
Page 3 - Plasma and Fusion Research,ISSN 1880-6821
P. 3
Plasma and Fusion Research: Regular Articles
Volume 13, 3402098 (2018)
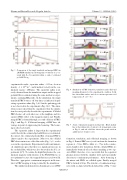
Fig. 3 Comparison of the single translated and merged FRCs in 2D MHD simulations; showing time evolutions of (a) ex- ternal field Be, (b) separatrix radius rs, and (c) estimated poloidal flux φp.
experimental results: separatrix radius ∼ 0.23 m, electron density ∼ 1 × 10²⁰ m−3 , and translated velocity in the con- finement region ∼ 200 km/s. The separatrix radius is di- rectly obtained from the simulation output and the trapped poloidal flux is estimated using the same method as exper- iments, assuming RR profile. In the simulation, the single translated FRC bounces off four times as indicated in pul- sating separatrix radius (Fig. 3 (b)) but the pulsating peak is not observed in the experiments (Fig. 2 (b)). The simu- lation is more ideal than the experiment; thus the simula- tion does not perfectly describe the experiments. Collided FRCs bounce off each other once at the midplane and two separate FRCs reflect at the magnetic mirror end. Finally, merged FRC is formed through a second collision of FRCs (Fig. 3 and Fig. 4). Collisional merging of FRC have ad- vantage in point of suppressing the bouncing. The bounc- ing is observed clearly.
The separatrix radius is larger than the experimental result, thereby the estimated poloidal flux is overestimated. In contract, the estimated poloidal flux of merged FRC is almost equal to the experiments. Moreover, the collided FRC shows an increase of the flux value (Fig. 3 (c)), as also seen in the experiments. Experimental results and numeri- cal simulations agree that there is a significant increase in the excluded flux, which was also observed in the C-2 ex- periments [4, 5]. To confine the high-flux plasma, the con- finement magnetic field structure of the FAT-CM device is not optimum because the trapped flux increased twofold. Therefore, appropriate confinement magnetic field struc- ture for FRC merging is being verified by the simulation.
The simulation demonstrates dynamic process of FRC
Fig. 4
Simulation of FRC formation, translation and collisional merging dynamics for the experimental condition. Solid line shows flux surface and color contour represents total temperature (T = Ti + Te).
Axial confinement magnetic field profile. Black dashed line is the field profile of current coil arrangement (same as Fig. 4), and red solid line shows the profile with an additional set of mirror coils.
3402098-3
Fig. 5
formation, translation, and collisional merging, as shown in Fig. 4. Formed FRCs are ejected out from the formation regions at ∼ 30 μs, FRCs collide at ∼ 35 μs in the confine- ment chamber after translation, but the collided FRCs are immediately bounced off each other remaining as two sep- arate FRCs; therefore, it is conceivable that the separated plasmas interact with the chamber wall, and it potentially deteriorates confinement performance. After bouncing at the mirror end, FRCs are collided again. Finally, merged FRC is formed at 80 μs. The structure of confinement mag- netic field, as depicted in black dashed line of Fig. 5, may
