
Page 3 - Outer Divertor Damage Characterization from Deuterium Plasma Bombardment in Graphene-Coated Tungsten
P. 3
544 NAVARRO et al. · OUTER DIVERTOR DAMAGE CHARACTERIZATION FROM DEUTERIUM PLASMA BOMBARDMENT
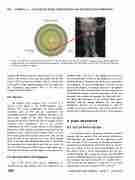
Fig. 2. (a) CAD view of the flat divertor plates in C-2W, showing also the position of the two samples, and (b) sample installment on divertor ring. The samples are spaced at approximately 5 cm apart from each other. Disks on each ring on the divertor plate can be biased to different voltages.
bonded with alumina paste to a shallow groove (~0.5 mm deep) in the stainless steel disks and placed side by side in the C-2W southern outer divertor (Fig. 2). Sample W2 to the right is a bare tungsten sample used as a control for the experiment, and sample W6 to the left has a graphene-coated surface.
II.B. Exposure
The samples were exposed over a period of 2 months (1210 shots) in the C-2W southern outer divertor. The surface temperature for these samples remained close to 0°C (at the temperature the cryopumps kept the chamber surfaces) because of the short pulse length of the shots. These discharges introduced numerous impurities onto the sample surface (stainless steel components due to the divertor composition) as well as some damage to the graphene. Exposures of the samples to plasma occur normal to the tungsten surface, and the duration ranges from 1 to 6 ms. Ion current plots show the flux decay over time, and as such, the flux is not uniform over time. Some sample plots of the raw and integrated data used to determine the deuterium ion temperature and flux are shown in Sec. IV. The integration of the data in these plots pro- vides the total fluence that the samples were exposed to.
II.C. Heat and Particle Flux Diagnostics
The C-2W device has various diagnostics to characterize the edge plasma; these are installed on the
northern side of the device. The samples are located in
the corresponding location of the diagnostics but in the
southern divertor. Parameters for the shots are assumed to
be symmetric on their corresponding locations on the
ends of the chamber. An energy analyzer is the primary
diagnostic for this characterization. Energy analyzers are
constructed in house; a detailed description of the con-
26
struction and operation is presented by Griswold et al. By taking the derivative of the current-voltage traces acquired with the energy analyzer, the ion energy distribution function can be determined to find the average ion energy of each shot. The current profile can also be used to determine the particle flux on the samples.
III. RESULTS AND DISCUSSION III.A. Heat and Particle Flux Data
As mentioned above, an energy analyzer is used to measure the ion particle flux and energy distribution. Unfortunately, the analyzer was not operational until after the start of the exposures of the pair of samples. Postexposure measurements from later shots are used to give an estimate of the ion fluxes and energies seen by the sample. Figure 3 shows measurements for one deu- terium discharge. The average ion energy was calculated from four different discharge results. The sample location sees average ion current densities of roughly 0.02 to 0.07 A/cm2 for the duration of each shot (1 to 6 ms) and typical ion average energies of 50 to 150 eV.
FUSION SCIENCE AND TECHNOLOGY · VOLUME 75 · AUGUST 2019
