
Page 17 - Progress minimizing fast-ion charge-exchange loss associated with gas injection on C-2W
P. 17
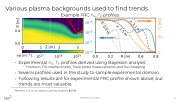
 Various plasma backgrounds used to find trends Example FRC ne, Te profiles
     1019 1018 1017
Te
 0.4 0.0
ne
50 0
0
1 Z [m] 2 3
19 1016
• Experimental ne, Te profiles derived using Bayesian analysis .
 ne [m 3]
17
18
0.0 0.2
R [m]
10
10
10
0.6 0.8 R [m] 1
• Thomson, FIR interferometry, Triple probe measurements, and flux mapping
• Several profiles used in the study to sample experimental domain.
• Following results are for experimental FRC profile shown above, but
trends are most valuable. 1Romero, J. A., et. al., Nature Communications 9 2018
 Presenter: Erik Granstedt 14
R [m]
Te [eV]
z: 3.1 m
z: 0.0 m
z: 1.5 m
