
Page 9 - Transport studies in high-performance field reversed configuration plasmas
P. 9
Here ωpe, ωpi and ωpb are the electron, thermal ion, and beam plasma frequency, respectively, and Ωce, Ωci and Ωcb are the electron, thermal ion, and beam cyclotron frequency, ρi the thermal ion Larmor radius, vb is the beam velocity, and Jn and In are the Bessel functions of the first kind of order n. The first term on the left is due to the plasma component, second is due to the beam, and the term on the right hand side is the vacuum and the electron terms.
The electron term includes EM modification [46].
(a) (b)
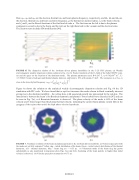
FIGURE 6. The dispersion relation of the ion-beam driven plasma instabilities in the C-2U FRC plasma. (a) Weakly electromagnetic analytic dispersion relation solution to Eq. (1), (b) Fourier transform of the Ex field of the fully EM PIC code. (a) and (b) agree on the location of the dominant mode. The plasma parameters used: B=0.267 T, ne=0.742x10¹⁶ m-3, Te- =Ti=500eV, beam is hydrogen and thermal plasma deuteron, and beam is 10% with energy 15 keV. The resonance at ω=6ωci is
close to the lower hybrid frequency: .
Figure 6a shows the solution to the analytical weakly electromagnetic dispersion relation and Fig. 6b the 1D simulation with PIC code. We have found that as ωpb/ωci increases the modes shown in black eventually intersect giving rise to the absolute instability – the yellow dots, with associated growth rate represented by the red dots. The interaction is between the beam’s ion Bernstein harmonic and plasma’s lower hybrid wave discussed in [47] and can be seen in Fig. 7(a), n=6 Bernstein harmonic is observed. The phase velocity of the mode is 60% of the beam velocity and 5 times larger than the plasma thermal velocity, indicating the current beam-plasma system falls in the category of the regime that satisfy the high phase velocity hypothesis.
(a) (b)
FIGURE 7. Nonlinear evolution of the beam and plasma particles in the ion-beam driven instability. (a) Velocity space plot with the mode not yet fully saturated. Yellow ring – initial distribution of the beam, Green – initial velocity distribution of the thermal deuterons, red – thermal deuterons, blue – beam ring at t = 0.53 μs. n=3 Bernstein mode in the beam ring has grown substantially as also manifested in dispersion plots Figs. 6(a) and 6(b). Scattering of the beam particle to higher than initial velocity is observed. (b) Velocity space plot at saturation t=0.73 μs.
020006-9
