
Page 2 - Absolute calibration of neutron detectors on the C-2U advanced beam-driven FRC
P. 2
11E125-2 Deng et al.
Rev. Sci. Instrum. 87, 11E125 (2016)
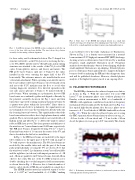
FIG. 1. SolidWorks design of the HSFIR system configuration with the top cover of the laser table enclosure hidden. The inset shows the polarizer assembly for fine-tuning collinear alignment.
for laser safety and for thermal isolation. The U-shaped box structure (referred to as the CO2 box) is for enclosing the two- color CO2/HeNe interferometer.2 Breadboards and mounting structures are attached to the outside of the CO2 box for FIR optics (beam splitters, mirrors, and lenses) and mixers. The FIR probe laser beam is split into 4 beams by the optics installed in the west, entering the upper half of the CV horizontally. The reference mixer is also installed in the west vertical arm attachment. When operating as an interferometer, the local oscillator (LO) laser beam is routed vertically down and across the C-2U machine near the floor to avoid other existing diagnostic structures. It is directed upwards in the east side, and is split into 4 beams to be mixed with the 4 probe beams. When operating as a polarimeter, the two FIR laser beams are combined together and aligned collinearly by the polarizer assembly shown in the Fig. 1 inset, and then turned into oppositely rotating circular polarization beams by a quarter-wave plate within the laser table.6 Since there is no LO beam involved for polarimetry, the signal mixers are moved much closer to face the exit windows directly with only the focusing lenses in between. This significantly reduced the laser beam refraction e↵ects due to high plasma density radial gradient. The z-cut crystal quartz windows are sealed with soft Indium metal and tilted by 2 to deflect the window surface reflected FIR laser power. The clear aperture and thickness of the windows are 7 cm in diameter and 3.903 mm, respectively. The FIR laser beam is designed following Véron11 to have a Gaussian beam waist of 1.8 cm near the center of the CV, and this is checked in the lab before installation.
In Fig. 1, the FIR laser beams are modeled by the larger tubes which cross the upper part of the CV with an angle of 79 with respect to the machine axis. The CO2 laser beams are modeled by the smaller tubes and only the part of the beam paths perpendicularly crossing the CV are shown. Note that the windows for the C-2 polarimetry system6 are still available and the sightlines (not shown) with impact parameters of 20 and 30 cm are parallel to the CO2 laser beams, but with 10 cm o↵set to the south. The use of the C-2 FIR viewports is for double checking the toroidal magnetic field measurements, as shown later in Fig. 4. However, due to limited number of mixers, only 4 chords of FIR data are available at a single shot.
The HSFIR interferometer has achieved superior resolu- tion of 1 ⇥ 1016 m 2 and bandwidth of >1.5 MHz,9 making
FIG. 2. Time trace of the HSFIR line integral density in a small time window, showing a low frequency down-chirping micro burst early (<5.8 ms) followed by a small amplitude medium frequency up-chirping fluctuation.
it an excellent tool for the study of plasma core fluctuations. Shown in Fig. 2 is a density trace measured in a neutral- beam sustained C-2U high performance FRC (HPF) discharge, showing a fast-ion driven micro burst followed by a medium frequency small amplitude fluctuation mode. Frequency analysis shows that the micro burst is down-chirping, while the small amplitude fluctuation is up-chirping. Detailed physics process of the micro bursts and methods to suppress them have been resolved by analyzing the FIR and other diagnostic data, and will be published elsewhere. However, detailed physics analysis of the higher frequency mode is an ongoing e↵ort.
III. POLARIMETER PERFORMANCE
The HSFIR polarimeter also achieved superior resolution, as shown in Fig. 3. With the innovative low noise FIR lasers,6,10 the instrument phase error (without plasma) for Faraday rotation measurement is 0.04 at a bandwidth of 500 kHz, with significant contribution from the low frequency mechanical vibration indicated by the thick curve in Fig. 3(a). In a typical high-density plasma shot, the r.m.s. phase errors increase to 0.1 for all chords at 500 kHz bandwidth as shown in Fig. 3(b). When the edge chord laser beams are crossing the FRC separatrix where beam refraction e↵ect is strong, i.e., ⇠0.3 ms for the +45 cm chord and ⇠7.5 ms for the +30 cm chord, the phase error can go up to 0.5 transiently. The density
FIG. 3. Polarimetry instrument resolution (a) and actual system resolution with high plasma density gradient (b).
