
Page 2 - Hanle effect as a magnetic diagnostics for field-reversed configuration plasmas
P. 2
11E703-2 Clary et al.
Rev. Sci. Instrum. 87, 11E703 (2016)
FIG. 1. The NPA device located on the C-2U experiment (left). The power supply and control rack (right) is located directly beneath the NPA.
III. REFURBISHMENT
This particular NPA was employed on the TFTR5 and NSTX7 experiments. Other instances of this device were em- ployed at ATF,8 LHD,9 and MAST.10 Transporting this device to TAE required disassembly, which provided an opportu- nity to refurbish an instrument that had been in service for nearly 30 years. Principle refurbishing actions were resur- facing the interior vacuum faces and re-application of anti- reflective paint and upgrading the control and data acquisition systems.
After complete disassembly of the NPA, stainless steel parts were given a black-oxide surface treatment. The main body of the NPA is constructed of mild steel and was resur- faced with 32 Ra sandblast, cleaned with a methanol spray, and coated with MH2200 paint.11,12 All parts were appropriately vacuum cleaned and baked. The MCPs were cleaned using several iterations of an ethanol evaporative bath in an air-bake chamber.
The MCP is operated in current mode with the anodes directly wired to the signal feedthroughs. Signal amplifica- tion and digitization occur immediately outside the MCP vac- uum feedthrough flange, allowing minimal distance between the MCP, amplifiers, and digitizers, ensuring minimal noise contamination. This is achieved by a versatile, compact data acquisition system developed by one of the authors. This sys- tem has a 120 channel capacity and can be controlled remotely via ethernet network, or locally via touch screen interface. The signal amplifiers have programmable trans-impedance gain, nominally set at 1 M⌦ with a rise-time of <10 μs. The digiti- zation rate for each channel is 1 MS/s with 12 bit resolution.
The MCP and mass-separator power supplies were up- graded from the original CAMAC systems to a more compact footprint. In addition, the control systems were upgraded from CAMAC to National Instruments cRio hardware. These improvements allowed the entire control system to be located in direct proximity to the NPA.
IV. CALIBRATION
Calibration of the NPA was done using a reverse Bayard- Alpert type ion source placed at the input of the NPA stripping cell chamber. H2 or D2 gas is bled continuously into the ion source chamber. The ion source is biased via a high voltage power supply, expelling ions into the NPA. Calibrations were
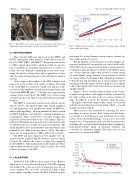
FIG. 2. Magnet current scaling vs. channel shows dynamic range ⇠30 and linear scaling with current.
performed for energy-channel correspondence, channel en- ergy width, and mass rejection.
Energy-channel correspondence for a given magnet cur- rent was established by sweeping the ion source bias from 0 to 45 kV. The beam sweeps past each channel as energy increases, resulting in a gaussian signal recorded for each channel. Anal- ysis of these gaussian shapes then provides a central energy for each channel (energy-channel correspondence) as well as the energy width of each channel. Repeating this procedure for both hydrogen and deuterium gas at various magnet current settings provides the magnet current scaling. It is not required to know the magnetic field value since B is proportional to the supplied current.
Figure 2 shows excellent linear scaling of the energy- channel correspondence with supplied current, evidenced by the tight overlap of the data points for various current set- tings. In addition, it shows the dynamic range Emax/Emin ⇠ 30. Figure 3 shows the energy widths, which are consistent with the classical limit inverse relationship ( E/E ⇠ 1/y and channels are linear with y).
Mass rejection was measured by repeating the above procedure at various electric field settings and fixed mag- net current, for both hydrogen and deuterium cases (sepa- rately). As the electric field changes, isotopes move across the channel rows. Comparing the hydrogen and deuterium cases determines the operational field which maximizes(minimizes) hydrogen(deuterium) signal on hydrogen channels and conversely for deuterium channels. The mass rejection was measured to be better than 1000:1.
FIG. 3. Energy width vs. channel shows expected 1/y dependence.
