
PIC simulation: Non-thermal distribution driven by NBI in high beta plasma
P. 1
[1] T. Matsumoto et al., Rev. Sci. Instrum. 87, 053512 (2016). [2] M. Binderbauer et al., Phys. Plasmas 22, 056110 (2015).
Developed Compact Toroid Injector (CTI) System
Formation
Section n
Formation
Section n
Fast-Framing Camera Camera setup
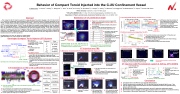
Composite image of CTI only and FRC only. (1) Starts penetration, (2) CT reaches FRC’s position, (3) CT disappears after crossing the center.
15-20% n n
The particle inventory was increased by 1 CT injection and kept high particle count for over 1 ms
FRC begins to degrade after 2nd CT
Successful CT injection is determined by the relative energy contents of the FRC and CT
CTs could destroy the FRC at late time injection
Inner Electrode I.D. O.D.
Φ54
The injected CT intersects the CO2 laser CT injection into FRC
Dα emission increased after CT injection
Φ83.1
CT formation process Upeak
1. Neutral gas injected between electrode from gas injection
1) Behavior of injected CT: Framing rate 500 kHz, Exposure 1.9 μs
Fast Camera Images
1st CT injection
Ø Exposure 50 μs After 1st CT
Ø Filter Blank
Before 2nd CT
2nd CT injection Neutral gas
emission
Outer Electrode
Copper Shell
-10 kV, ~190 kA
ports. Also, bias field applied to magnetize plasma.
2. Main power supply is triggered to generate a plasma. Then
the gun current starts.
3. The radial current between electrodes generates a toroidal
magnetic field. Then plasma is accelerated by Self-Lorentz
n
n Thiscanbeseeninteractingwithedgeplasma n When 2nd CT enters it collides with the cloud
Behavior of Compact Toroid Injected into the C-2U Confinement Vessel
T. Matsumoto,1 T. Roche,2 I. Allfrey,2 J. Sekiguchi,1 T. Asai,1 H. Gota,2 M. Conroy,2 E. Granstedt,2 C. Hooper,2 J. Kinley,2 T. Valentine,2 W. Waggoner,2 M. Binderbauer,2 T. Tajima,2,3 and the TAE Team
Abstract
1Nihon University, Chiyoda-ku, Tokyo 101-8308, Japan
2TRI ALPHA ENERGY, INC., P.O. Box 7010, Rancho Santa Margarita, CA 92688-7010, USA 3Department of Physics and Astronomy, University of California, Irvine, Irvine, CA 92697, USA
Estimation of CT penetration depth
Line-integrated density increased by 10–20%
The compact toroid (CT) injector system [1] has been developed for particle refueling on the C-2U device [2]. A
CT is formed by a magnetized coaxial plasma gun (MCPG) and the typical ejected CT/plasmoid parameters are as FRC follows: average velocity ~100 km/s, average electron density ~1.9×1015 cm-3, electron temperature 30–40 eV, mass shape ~12 μg. To refuel particles into FRC plasma the CT must penetrate the transverse magnetic field that surrounds the
FRC. The kinetic energy density of the CT should be higher than magnetic energy density of the axial magnetic
field, i.e., ρv2/2≥ B2/2μ0, where ρ, v, and B are mass density, velocity, and surrounded magnetic field, respectively. CT Also, the penetrated CT’s trajectory is deflected by the transverse magnetic field (Bz ~1 kG). Thus, we have to
estimate CT’s energy and track the CT trajectory inside the magnetic field, for which we adopted a fast-framing
camera on C-2U: framing rate is up to 1.25 MHz for 120 frames. By employing the camera we clearly captured the CT/plasmoid trajectory. Comparisons between the fast-framing camera and some other diagnostics as well as CT
injection results on C-2U will be presented. Vessel
CT can easily reach FRC
n Figures (1-3), fast-framing camera images (NAC Image Technology) are composite images of CTI only and FRC only
n To evaluate the penetration depth, both pictures are combined
n CTI only: Frame rate 500 kHz, Exposure 1.9 𝛍s
(1) CTI2, (2) CTI1, (3) CTI2
(1) 1 CT (2) 1 CT (3) 1 CT
(1) CTI1 + CTI2, (2) CTI2 n (1) 2 CTs Stable (2) 1 CT
(No wobble)
Left figures show time evolution of line-integrated electron densities: (Left) 3 CT injections; (Right) 2 CTs injection and 1 CT injection
Time (μs)
Intensity (a.u.)
Particles (×1019)
nedl (×1015 cm-2)
Main discharge Parameter
n Charging Voltage: -10 kV n GasInjectionPorts n Maximumcurrent:~190kA e Ceramic Break n Rise time: ~10 μs Te
Bias coil Φ n Inserted inside inner v⊥
electrode Etot n Movable
Value
5 × 10²¹ (m-3) 30 - 40 (eV) 0.4 (mWb) 100 (km/s) 0.4 - 0.8 (kJ) >20 (kJ/m3)
n
Time evolution of the CO2 interferometer.
1st CT
Time (ms)
2nd CT
n n
Bias Coil
t=0
(Relative time to CTI)
No filter
t=8 μs
n Penetrated CT Starts
t=14 μs
t=46 μs
force.
4. The accelerated plasma is interlinked with applied bias
field. Thus the spheromak-like plasmoid is formed and ejected from CTI.
CTI installation on the C-2U confinement vessel
Schematic view of developed Compact Toroid Injector
n CT penetrated t=0
t=46
n Hot neutral gas started n The hot neutral gas/
Injection axis
FRC
CTI1
(a)
0
to Pulsed-Plasma 0.1
CTI2 CTI1
0 40 80 120 160
The electrode is semi-
The system is similar 0.2
w/ PI
minimized
n No burst of light when CT is
injected
n With PI FRC particle
inventory was increased by about 10%
(a) Top-view and (b) End-view of the C-2U Vessel Projection of the CT is near the machine center
n Two CT injectors are installed on the confinement vessel
n CTI2 has multi-pulse system. It can inject up to 2 CTs. Also, pre-ionization
system was installed to control total injected particles n OurCTIsystemcaninjectupto3CTspershot
FRC shape
FRC
vion
(b)
Diagnostics Magnetic Probe
CO2 Interferometer
Bolometer and PMT array
Doppler Fast Camera
Parameters
Fluctuation
Line-integrated electron density
Emission
Ion temperature
Macroscopic behavior
Thruster
00 1 2 3 4 5
Time (ms)
D𝝰 emission w/ and w/o PI system Conclusion
CTI2
n CT injection into C-2U FRC was successfully demonstrated.
n Particle inventory was increased by ~20% at injection time and remained high for over 1 ms. n The fast-framing camera was mounted on the C-2U confinement vessel and captured moving
pictures with true color.
n We determined penetration depth and behavior of the CT inside the confinement vessel.
n Pre-Ionization system mitigates neutral-gas introduction allows for control of CT particle inventory. n The process of the particle refueling by CT injection has been characterized.
Main Diagnostics to estimate the CT injection
1.5 μF <10 kV
n
Inner Electrode
Confinement
FRC Formation Section
(1)
(2) (3)
n FRC only: Frame rate 50 CT n
~3.1 x 1015 cm-2
kHz, Exposure 20 𝛍s
Left figures show density
measurement by CO2 interferometer
The penetrated CT intersects interferometer chords
CT had high electron density at the center
CT can deliver a lot of particles through the magnetic field
n The density was mainly increased center chord in both cases
n The increased density was 10–20% wobble motion
collided with FRC
rotating around the FRC
plasma twists around FRC
CT injection with Pre-Ionization system [I. Allfrey, CP10.00085]
collide
Picked up the values of green line at each frame
• Coax Electrode (Cu)
• Insulator (Teflon) 0.5
w/o PI n
Before injection After injection
Emission
Line out from each frame
1 n n
n
The FRC’s emission not seen before CT
injection n When CT injected, FRC emission increased
At this time, particle inventory measured by
interferometry increased
0.4 rigid electrode 0.3
Dα emission at CTI plane
2) Behavior of FRC by 1 CT: Framing rate 50 kHz, Exposure 20 μs
#48604
Return to original position
Gas puff
Schematic diagram of PI system
n
No filter
FRC is stable
n
n
n
FRC returned to original position by tension of externalmagneticfield
t=0
(Relative time to CTI)
t=40 μs
Collided CT
Injected CT collided with FRC
t=120 μs
FRC was pushed to opposite side of CT (duetomomentum)
t=200 μs
From SE CTI
#48608
Unstable
Unstable
Time (ms)
Particle inventory increased by 15–20%
Time (ms)
It started
First CT leaves a trail of neutral particles
Pre-Ionization needed to reduce trailing neutral gas
| 1 |
