
Page 3 - Internal magnetic field measurements of translated and merged field-reversed configuration plasmas in the FAT-CM device
P. 3
10J114-3 Gota et al.
Rev. Sci. Instrum. 89, 10J114 (2018)
performed at various frequencies of 1–500 kHz. This bench test/calibration was also performed with and without the SS304 tubing, which resulted in no significant differences in signals (e.g., amplitude and response time) for such a frequency range due to very thin wall thickness. Meanwhile, in the FAT-CM experimental setup, signals from the radial probe array get transferred to the data-acquisition system inside a screen room using well-shielded coaxial cables. To reduce high-frequency noise on the signal, an RC filter (time constant ∼ 33 μs) is connected before the digitizer (Yokogawa, Model 701250, 10 MS/s, 12 bits). The acquired signals are numerically integrated to estimate magnetic fields. For accurate two-axis field mea- surements, the installed probe array was initially aligned and calibrated in situ by using uniform and known vacuum Bz field in the confinement region of FAT-CM, at which an orienta- tion of the whole probe assembly was adequately aligned to minimize signals on Bt pickup coils. By doing this in situ cali- bration for individual pickup coils, the actual measured signals in a plasma discharge can be accurately corrected.
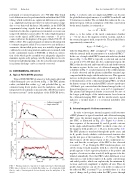
III. EXPERIMENTAL RESULTS A. Typical FAT-CM FRC plasmas
Typical FAT-CM FRC plasmas for both single-sided and collision/merged cases are shown in Fig. 3. The FRC plasma radius (excluded-flux radius r ∆φ ) and poloidal flux φp are estimated using B-dot probes near the mid-plane, and line- integrated electron density is measured by a He-Ne laser inter- ferometer system12 in the mid-plane of the FAT-CM device.
In Fig. 3, it shows only one single-sided FRC case because the global behavior/performance of each FRC from the R- and V-formations is similar. The excluded-flux radius in the con- finement region, with an assumption of the flux conservation by the metal chamber, is estimated as
r ∼r1−B/B, (1) ∆φw 0e
where rw is the radius of the metal confinement chamber (r ∼ 0.4 m), B0 is the magnetic field in vacuum, and Be is the external magnetic field, respectively. The poloidal flux is approximately estimated as
φp RR ∼ 0.31πBer3 /rw, (2) ∆φ
with the Rigid-Rotor (RR) assumption8,9 that is consistent with the internal field measurements for translated FRCs.13 In the case of single-sided FRC formation/translation (dashed lines in Fig. 3), the FRC is typically accelerated and ejected at a speed of 150–200 km/s into the confinement region; the FRC is then decelerated and bounced back-and-forth between the mirror regions. In the case of collisional-merging FRCs (solid lines in Fig. 3), a radial expansion of the collided plasma is clearly observed and the plasma radius/flux remains large compared with the single-sided translation case. This apparent increase in the plasma radius (diamagnetic signal) is due to a re-thermalization of the collisional-merging FRCs, in which the kinetic energy of the translated FRCs (relative speed up to ∼400 km/s) gets converted into the thermal energy by the col- lisional merging process, as also seen in C-2 experiments.6 The plasma line-integrated density is increased because of the longer path-length of the interferometer laser beam in the collisional-merging FRC, and the interferometry signal indicates a toroidal mode n = 2 rotational instability after t ∼ 200 μs.
B. Internal magnetic field measurements
In order to investigate internal magnetic field structures of FRC plasmas for typical translated and collisional-merging FRC cases, the internal magnetic probe array was inserted into FRC, as illustrated in Fig. 2(b). Figure 4(a) shows a time sequence of the measured Bz and Bt profile contours in the single-sided/translated FRC, in which a time slice of the magnetic field profiles at t = 46 μs is shown in Fig. 4(b). The FRC plasma is translated through the probe array, and its Bz profile clearly exhibits a field-reversed structure dur- ing the first pass of the translation (t ∼ 35–50 μs). The FRC then bounces off the mirror region of the confinement sec- tion, and then the second pass of the FRC is also observed at around t ∼ 75 μs. During the FRC translation phase, rel- atively strong toroidal magnetic field Bt is observed and its profile appears to have opposite polarities at the positive and negative y locations; in other words, Bt field appears to be dis- tributed azimuthally. Note that FRC radial shift/mode is not taken into account in those figures of Bz and Bt contour maps and radial profiles, which can explain why the minimum Bz location (and its Bt amplitude) is slightly off axis. These Bt profile characteristics can also be seen in the second pass of the reflected FRC at around 75 μs, in which there is a clear sign of change in Bt polarity when the FRC passes through
FIG. 3. Plasma parameter comparison of single-sided and collision/merged FRCs: time evolutions of (a) excluded-flux radius r∆φ, (b) estimated poloidal flux φp, and (c) line-integrated electron density near the mid-plane of the device.
