
Page 4 - Development of a three-wave far-infrared laser interferometry and polarimetry diagnostic system for the C-2W field-reversed configuration plasmas
P. 4
10B109-4 Deng et al.
Rev. Sci. Instrum. 89, 10B109 (2018)
The CO2 and FIR lasers are cooled by using recirculat- ing chillers, and the operation temperature is set to 14 ◦C with a temperature stability of 0.1 ◦C. The low operation tem- perature can prolong the laser lifetime and increase the laser power outputs. To ensure the temperature stability, the lasers are installed on phenolic blocks to reduce the thermal conduc- tivity between the laser systems and the optical table. Thermal isolation foams are attached to the exterior of the optical table and the aluminum enclosure so that the ambient temperature swing has a minimum effect on the laser stability. The thermal control measures are successful as the FIR system can operate with stable signals for a few hours without tuning or feedback control.
F. System control and operation
Before thermal equilibrium is reached, remote laser tun- ing and control is required. The FIR laser cavity lengths are controlled by using Thorlabs motorized translation stages and matching controllers locally. The control personal computer (PC) is installed inside the EMI shielded cabinet under the optical table. Remote FIR laser control is achieved by using fiber Universal Serial Bus (USB) links between the optical table and the control PC. The CO2 laser for pumping the FIR lasers is controlled by using an analog fiber link. In the PC end, the control voltage from a LabJack U3-HV DAQ unit is converted into infrared light. In the optical table enclosure, the infrared light is detected by using photo diodes and amplified and low-pass filtered before it is used to control the CO2 laser. The pressure of the FIR working gas is also monitored by using USB fiber links between the vacuum gauge in the optical table and the control PC. When tuning the lasers, the IF signal is monitored by using a sampling digital oscilloscope attached to the control PC. When it is needed, the chiller operation tem- perature can also be adjusted remotely from the control PC. All control and monitoring functions are integrated into a cen- tralized LabView program. During the routine operation, the operator can access the control program from the office or the control room via remote desktop connection.
III. INITIAL EXPERIMENTAL DATA A. Interferometry data
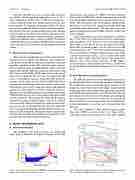
The cleanness of the power spectrum of a digitized IF signal (Fig. 4) illustrates the high performance of the FIR
FIG. 4. Sample Fourier power spectrum of FIR raw data before and during a plasma shot, each from a time window of 5 ms.
interferometry. The peak near 3 MHz is the beat frequency between the two FIR lasers, and the raised power near the IF peak during plasma discharge is due to plasma density fluctu- ations. The raised power near zero frequency during plasma discharge is the far-forward scattering spectrum from long wavelength plasma fluctuations.6 The only noise seen is the digitizer switching noise near 0.5 MHz, which is −90 dB down and is negligible.
Line-integral densities from all 14 channels are shown in Fig. 5. Due to the very small noise level, very small ampli- tude fluctuations can be detected. A new micro-burst insta- bility which occurs only in the new advanced neutral beam driven FRC operation regimes was first discovered by FIR interferometry in C-2U.7,8 In C-2W early FIR data, the ampli- tude of microbursts is relatively small and one of the bursts is shown in the insets in Fig. 5. It is a plasma core mode and can easily escape from detection by edge diagnostics. However, due to the excellent sensitivity of FIR diagnos- tics the frequency down-chirping waveform is clearly seen by all FIR channels including the channel at 0.527 m (lower inset).
B. Abel inversion of density profiles
The FIR laser probe beams pass through the plasma near the mid-plane (Sec. II), where the plasma is mostly cylindrical. For a tilted laser beam passing through the plasma, it will sample the same density layers with longer integration path length comparing to a laser beam of the same impact parameter but with direction perpendicular to the CV axis. Therefore, the line-integral densities from the tilted chords can be multiplied by a constant factor of cos(15◦) so that they are aligned with the data from the vertical chords and electron density profiles in the perpendicular cross section can be obtained from Abel inversion.
The time evolution of Abel inverted density profiles from shot 105094 is shown in Fig. 6. It begins with a nearly flat profile, becomes hollow over time, and eventually
FIG. 5.
the 7 tilted chords (middle) and the vertical chords (bottom).
Plasma excluded flux radius (top), raw data of FIR interferometry for
