
DPP2018_EParke_v2
P. 1
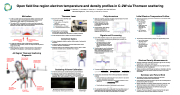
 Open field line region electron temperature and density profiles in C-2W via Thomson scattering
 E. Parke, A. Ottaviano, T. Schindler, K. Zhai, M. C. Thompson, and the TAE Team
TAE Technologies, Inc., 19631 Pauling, Foothill Ranch, CA 92610
 Motivation
n C-2W is a field-reversed configuration (FRC) experiment with goals that include increasing plasma lifetimes and electron temperatures with respect to its predecessor C-2U
n The central FRC is enclosed in a mirror-confined scrape-off layer (SOL) which collapses into axial plasma jets along open field lines on either side of the central vessel
Thomson Laser n Ekspla NL310 series Nd:Y AG laser
n 4 pulses at 100 Hz
n 2 J per pulse, < 5% long term
variation
n Divergence < 0.5 mrad
n Pointing stability < 100 μrad
n < 1 mm beam diameter at focus
n Beam paths for central laser
and jet laser can be switched
to provide increased time resolution in region of interest
n Pulse energy monitor at output for density calibration Collection Optics
n Custom designed collection optics utilize a pair of achromatic doublets
n Collection optics mounted on free-standing support under C-2W for vibration minimization
n Distance from lens to scattering region is 52 cm, with 7 radial positions available across diameter of jet region
Polychromators
n Detection system consists of 5 filter polychromators from GA with avalanche photodiodes (APDs)
n Each polychromator has 5 filter channels covering wavelengths from 850 nm to 1170 nm
n Polychromator filter design provides sensitivity to electron temperatures ranging from 10 eV to 2 keV
Signals and Processing
n Each APD amplifier outputs a DC signal and an AC signal
n DC signal yields the background plasma signal, necessary for error estimation
n AC signal consists of a delay- line subtracted signal which reduces background signal and isolates the Thomson scattered signal
n Gated integrator used to determine total scattered signal during TS laser pulse with timing jitter < 1 ns, gated signals digitized with 16-bit, 1 MHz resolution
Initial Electron Temperature Profiles
n First measurements of electron temperature in translating FRC prior to merger
n FRC translates past Jet TS at ~20 us
n Single-sided FRC temperatures observed to be ~200 eV
n Jet Te remains high for ~100 us
n Jet plasma profiles following merger are significantly cooler n Jet Te cools rapidly
following merger
n Jet Te on axis tracks closely with core FRC Te, but jet profile is more narrow
Electron Density Measurements
n Rayleigh scattering calibration with Argon gas is not currently feasible due to stray laser light issues
n Misalignment of baffles may contribute to stray light problem and requires further investigation
n Raman scattering with Nitrogen provides an alternative density calibration option that avoids using the channel at the laser wavelength
Summary and Future Work
n Jet region Thomson scattering diagnostic has been successfully installed and commissioned
n Initial temperature measurements capture the first temperature profiles during FRC translation
n Raman calibration for density measurements is planned, with additional diagnosis and mitigation of stray light sources
n Study edge plasma behavior with different biasing and magnetic field configurations
n Compare Thomson data with measurements from jet region interferometer under different plasma conditions
        Jet Region Thomson scattering measurement locations
Central Thomson scattering measurement locations
  n A range of magnetic field configurations and biasing conditions are achievable, which can impact both the plasma edge and the FRC
n Measuring the properties of the plasma jet is important for studying FRC translation, confinement and sustainment
Jet Region Thomson Scattering Diagnostic
    Central system: Brewster window Alignment Camera Beam dump
Central system: Scattering region
 Central system: Brewster window 3m focusing lens
      Scattering Volume Calibration n 5 fiber bundles couple scattered light to polychromators
n Scattering volume locations determined by in-vessel backlighting of fibers – volumes are 1.5 cm long with 5 cm spacing: -10.07 cm, -4.84 cm, 0.17 cm, 5.17 cm, 10.33 cm
n Thomson scattering spectrum is given by !()*+,-./%Ω 7Δ$ /+ Δ$ =
/+ Δ$ + !"#$#%$#%Ω=01sin6⁄2$( 1−2$(+4?+$=(sin6⁄2 exp−4?+$+(sin6⁄2 %$#
             n Temperature and density inferred through Bayesian statistical analysis
n Predicted Thomson scattered signal for each channel is calculated for a given temperature and density
n Likelihood of predicted signal given the measured signal for each
      channel is:
n Total likelihood is product of likelihoods for each channel
Ltotal =ΠchLch.
n The probability distribution yields both the most likely value of
temperature/density (maximum likelihood) and the error for each value from the width of the distribution (1/e width)
L = 1
ch (2π *Variancepulse )1 2
(S −Sexp)2 ts ts
 e2*Variancepulse
  Jet system: Alignment camera Beam dump
Jet system: Scattering region
Jet system: Alignment camera Brewster window 2m focusing lens
Backlighting of object plane in confinement vessel using lamp at fiber polychromator input
Close up of fiber bundle image
| 1 |
