
Page 3 - Collisional merging formation of a field-reversed configuration in the FAT-CM device
P. 3
Nucl. Fusion 59 (2019) 056024 T. Asai et al
Figure 1. Schematic view of the experimental device FAT-CM consisting of two FRTP formation sections and central confinement section (top) and axial profile of the external guide magnetic field.
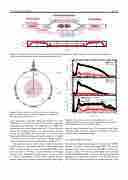
Figure 2. Illustration of a cross-sectional view of the installed probe assembly with probe locations (marked as red dots) in the mid-plane of the FAT-CM device.
in the formation section. The radial scale paramter S* of the FAT-FRCs is ~9.8 for 6.2 in the C-2U just after collisional merging process. Therefore, the FAT-CM covers MHD like parameter region complementary with the C-2 series of exper- iments. The oscillating signal on the line-integrated electron density of merged FRC (#1736) in figure 3(c) represents the rotational instability with toroidal mode number n = 2, which is typically observed in FRC experiments without stabiliza- tion as an indicator for successful formation of FRC [16].
This apparent increase in the plasma radius (diamagnetic signal) is due to a rethermalization of the collisional-merging FRCs, in which the kinetic energy of the translated FRCs (rel- ative speed up to ~400 km s−1) gets converted into thermal energy by the collisional merging process, as also seen in C-2 series of experiments [17]. The volume expands approxi- mately 30 times larger than the formation and five times larger
Figure 3. Time evolutions of (a) excluded flux radius rΔφ, (b) trapped poloidal flux φp_RR and (c) line-integrated electron density. The hatched area indicates standard deviation.
than the single translation case. The increment from single translation indicates higher efficiency of energy conversion in the case of the collisional merging.
3.2. Internal magnetic structure
In order to investigate internal magnetic field structures of FRC plasmas for typical collisional-merging FRCs, the internal magnetic probe array is inserted into the FRC as illustrated in figure 2. Figure 4 shows the contour maps of the poloidal and toroidal magnetic field evolution measured by the internal magnetic probe array in the mid-plane of the FAT-CM device. The observed internal poloidal and toroidal magnetic field
3
