
Page 4 - Collisional merging formation of a field-reversed configuration in the FAT-CM device
P. 4
Nucl. Fusion 59 (2019) 056024
T. Asai et al
Table 1. Principal parameters of the FAT-FRCs.
Formation
Single translation Collisional merging
rΔφ lΔφ (m) (m)
0.06 1 0.08 — 0.2 1.6
〈ne〉 (m−3)
25 × 1020 2.0 × 10²⁰ 2.5 × 10²⁰
Volume (m3) S*
0.007 9.3 0.04 3.0 0.2 9.8
Collisionality (rΔφ/λei)
~0.01 ~0.5 ~0.6
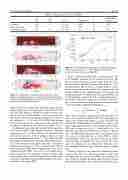
Figure 4. Contour maps of magnetic-fields (Bz and Bx) radial profiles as a function of time in (a) the single-translation and (b) the collisional-merging FRC plasma, measured by the internal magnetic probe array in the FAT-CM mid-plane.
profile in the case of single side translation (figure 4(a)) is similar with the previous experiments conducted in the TCS [14]. The FRC plasma is translated through the probe array and its Bz profile clearly exhibits a field-reversed structure with modest amount of toroidal flux during the first pass of the translation (t ~ 35–50 μs) [12]. The FRC then bounces off the mirror region of the confinement section, and then the second pass of the FRC is also observed at around t ~ 75 μs.
As shown in figure 4(b), the translated and merged plas- moid does not show a FRC structure during the collisional merging process (t ~ 25–60 μs). However, re-organized stable field-reversed structure of the Bz profile is observed in the quiescent equilibrium phase after t ~ 75 μs. Here, the FRC performance and lifetime are obviously affected by the pres- ence of the invasive internal probe array. The configuration lifetime was shortened to ~150 μs compared with ~300 μs in the longer-lived FRC without internal probe array. In the collisional-merging FRC, each of the two-translated plas- moids appears to carry significant toroidal magnetic fields with opposite helicity, and the strong Bx observed during the collisional-merging process still remains slightly at the quies- cent phase of the merged FRC.
Figure 5. Position-shifted Bz radial profile of collisional-merging FRC at a quiescent phase (t = 80 μs). Hatched area indicates integration region to evaluate poloidal flux.
Figure 5 shows the radial profile of axial magnetic field at the midplane measured by the internal probe array. The observed poloidal magnetic profile clearly shows the field- reversal structure. The inflection point of the profile at r = 0.2 m approximately agrees with rΔφ. An RR model is a well- known and adequate profile model for the magnetic field and density of FRCs in the equilibrium phase as well as for the translated plasmoid. The poloidal flux (φp_RR) of the FRC can be approximately estimated from the excluded flux measure- ment with the RR model, expressed as equation (2). By con- trast, a direct measurement of the magnetic field profile yields a relatively simple poloidal flux definition as
4
φp = −
ˆ R ˆ rs 2πrBzdr =
0R
2πrBzdr, (3)
where, R is the radius of magnetic field null point (Bz = 0), and rs is the separatrix radius of FRC that is approximately equal to the excluded flux radius rΔ𝜙. In the ideal FRC, the poloidal flux amounts inside and outside R are equal to each other. Using equations (2) and (3) the poloidal flux inside the FRC can be estimated as: φp_RR ~ 1.5 mWb and φp_RR ~ 0.6 mWb. The discrepancy between the two estimates could be due to the FRC radial shift/motion that is not properly taken into account, in particular the case when FRC is shifted perpendicularly away from the probe array which makes underestimation of poloidal flux. Also possible SOL may cause overestimation on the excluded flux. Therefore, these two estimations determine upper and lower limit of trapped flux.
In either of both cases, the amount of re-organized poloidal magnetic flux after the collisional merging is larger than the trapped flux of less than 0.5 mWb in the formation sec- tion, in spite of possible disturbing effect from the invasive internal magnetic probes. In the single side taranslation case,
