
An Interesting Poster to look at from the Tri Alpha Energy Team in California
P. 1
Cross-separatrix Coupling in Nonlinear Global Electrostatic Turbulent Transport in C-2U
Calvin K. Lau1, Daniel Fulton2, Jian Bao1, Zhihong Lin1, Michl Binderbauer2,3, Toshiki Tajima1,2, Lothar Schmitz2 1UNIVERSITY OF CALIFORNIA, IRVINE, Irvine, CA 92697, 2TAE Technologies, Inc., 19631 Pauling, Foothill Ranch, CA 92610, 3UNIVERSITY OF CALIFORNIA, LOS ANGELES, Los Angeles, CA 90095
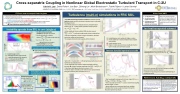
Turbulence (multi-n) simulations in FRC SOL
▪ First ANC electrostatic turbulence simulations confined to just SOL (multi-n coupled core-SOL turbulence simulations soon to come with field-aligned mesh)
▪ Gyro-kinetic deuterons + adiabatic electrons, multiple toroidal modes (n={5, 10, .. 75, 80}) provide qualitative transport picture
▪(ηi =2,R0 =5,ηe =0) LTi
▪ Mode amplitude history is plotted: RMS saturation around eφRMS −3
Te ~𝒪 10 ,andlinearlystablemodesshownasdashedlines
▪ Saturation amplitude is similar to single-n simulations, saturation mechanism unlikely to have changed
▪ Grey regions denote boundary regions within simulation
(A) : instability grows most quickly with higher-n modes (B) : linearly stable low-n modes overtake linearly unstable
mid-n modes
(C) : mode saturation occurs
(D) : higher-n modes saturate at lower amplitudes than the
lower-n modes at end of inverse cascade
Inverse toroidal spectral cascade
▪φ R,Z,θ = 0 andφ R,Z = 0,θ duringlineargrowthphase(B)and
nonlinearly saturated phase (D)
▪ Short wavelength linear mode to longer wavelength turbulent
structures change of average wavelength from k ρ ~1 to k ρ ~0.5 ζs ζs
▪ Clear linear radial eigenmode structure seen in A & B
▪ Similar to single-n simulations, the mode structure spreads radially during the nonlinear phase and widens as in C, D
▪ Short wavelength modes grow first in linear stage A & B, ie. n = 55 kρ~0.90 &n=65 kρ~1.06
ζs ζs
▪ Inverse cascade starts with n = 5, due to mode-mode coupling
between higher-n modes
▪ Agrees with previous assumption (local linear stabilities simulations) for inverse cascade mechanism for how SOL fluctuation spectrum produced
A New Code (ANC)
C-2magneticgeometry
Core & SOL are coupled
(cylindrical coordinates)
Field-alignedmeshhasbeen developed and tested -- production runs forthcoming
ANC is a first-principles, integrated simulation code being developed with the experience of GTC developers for FRC turbulence simulations capable of coupling the core and scrape-off layer regions.
FRCs are now at transport-limited regimes
Advancedbeam-drivenFRCsatTAEhavelifetimesofmilliseconds;turbulencesimulationsrequiredforunderstanding
confinement scaling and future devices
Previous local GTC simulations (see references) of realistic C-2 equilibrium for k ρ ≤ 0.3, η = LT
▪ Unstableion-to-electronscalemodesinscrape-offlayer(SOL)
▪ CoreisstabilizedbyionfiniteLarmorradius(FLR),magneticwell(grad-B),electronparalleldynamics
Experiment:fluctuationsexistincore(butlowerinamplitude);Simulation:corelinearlystable Does turbulence spread from SOL?
ζe −1 Ln
−1
= 1, κ = R0 ≤ 5 find Ln
Ion heat transported outward
2 ▪ Max ion energy flux at point of saturation (C): Φ𝑞,𝑖 ~6 KW/m
2 ▪ Upper bound electron energy flux (test electrons) : Φ𝑞,𝑒 ~4 MW/m
▪At point of saturation (C), not much change in profile saturation not due to profile relaxation
▪ Outward ion heat transport is consistent with flattening of temperature profile
2 Dclassical = ρi /νii
Instability spreads from SOL to core (single-n)
▪ First ANC nonlinear electrostatic simulations coupling FRC core and SOL
▪ Gyro-kinetic deuterons + adiabatic
electrons δne =eφ ,singletoroidalmodeonly
n0 Te
▪(η =2,κ =R0 =5,η =0) i iLT e
i
slab-like ITG linear instability ▪ Inward spreading due to physical
coupling of field-lines by FLR effects
similar trend in experimental measurements of density fluctuations
𝐧=𝟑𝟎 𝐤𝛇𝛒𝐬~𝟎. 𝟓𝟓
(I) : instability begins in SOL
(II) : radial eigenmode structure formed (III) : radial spreading and SOL saturation (IV-V) : mode saturates at different amplitudes between core and SOL
(field-line averaged)
Outward propagation
Saturation amplitude lower in core vs SOL
Simulation phase velocity similar to experimental turbulence propagation
outside separatrix (r > R ):
(r < R ) s
s ▪Exp: 1.55x10⁴ m/s
3 ▪Sim:5.5x10 m/s
Inward propagation
4
inside separatrix (r < R ):
s ▪Exp:-2.6x10 m/s
3 ▪Sim:-4.2x10 m/s
(r > R ) s
(r < R ) s
experiment
simulation
References, funding, contact info
D.P.Fultonetal,Phys.Plasmas23,012509(2016) D.P.Fultonetal,Phys.Plasmas23,056111(2016) L.Schmitzetal,NatureComm.7,13860(2016)
C.K.Lauetal,Phys.Plasmas24,082512(2017)
http://www.trialphaenergy.com/research-library/
Alsoseepostersby L.Schmitz,D.Fulton,andJ.Bao! Further questions? Contact me at calvin.lau@uci.edu
This work was carried out at University of California, Irvine with the support of the Norman Rostoker Fellowship and Tri Alpha Energy subcontract (Grant No. TAE- 200441). Simulations used the resources of DOE Office of Science User Facilities: Oak Ridge Leadership Computing Facility at Oak Ridge National Laboratory (DOE Contract No. DE-AC05-00OR22725) and National Energy Research Scientific Computing Center (DOE Contract No. DE-AC02- 05CH11231).
| 1 |
