
TMatsumoto_APSDPP2019_v9_tr
P. 1
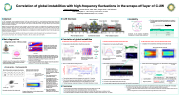
  Correlation of global instabilities with high-frequency fluctuations in the scrape-off layer of C-2W
Tadafumi Matsumoto1,2, Thomas Roche1, Matt Tobin1, Roger Smith1, and TAE team
1TAE Technologies, Inc., 19631 Pauling, Foothill Ranch, CA 92610 2University of California Irvine, Irvine, CA 92697
   n Abstract
In TAE Technologies’ current experimental device, C-2W (also called “Norman”) [1], record breaking, advanced beam-driven field reversed configuration (FRC) plasmas are produced and sustained in steady state utilizing variable energy neutral beams, advanced divertors, end bias electrodes, and an active plasma control system. Global MHD modes are largely stabilized by sheared plasma rotation just outside the separatrix.
Magnetic [2] and electrostatic probes have been installed in the open field line region to investigate the FRC stability and fluctuations outside the separatrix. Each probe has a wide bandwidth; therefore, we can observe and compare not only MHD modes but also high frequency fluctuations. Additionally, the FRC density profile at the mid-plane as well as plasma’s global motion can be observed with far infrared interferometry (FIR). By combining these diagnostics, we investigate the correlation between the motion of the core plasma and fluctuations outside the separatrix.
The correlation between global instabilities and high-frequency fluctuations outside the separatrix will be presented and discussed. [1] H. Gota et al., Nucl Fusion, 59, 11 (2019) [2] T. Roche et al., Rev. Sci. Instrum. 89, 10J107 (2018)
 nMain diagnostics
n Magnetic probe – Mirnov probe
Bx, By, Bz
Confinement vessel
n=1
n=2
Sample plot of toroidal mode numbers, n=1 and n=2 mode. Fourier transform has been used to determine the mode numbers.
    B-dot probes
Time (ms)
Core plasma
Schematic view of the cross-section of the Mirnov probes and design of the B-dot probe including slow and fast b-dot probes
n Mirnov probe system contains two types of b-dot probes. One is the slow response and another one has fast response. Slow b-dot probes focus on MHD activities. On the other hand, the fast b-dot probes are focusing on the higher frequency oscillation by measuring the dB/dt signal.
n To observe/split the MHD activities, Singular Value Decomposition (SVD) and FFT methods have been adopting.
 n Single probe – floating potential
Table: Probe position and angle of each probe
Ceramic
General equation of floating potential can be written as:
Where ! is plasma potential and " is constant
factor that depends on spicies
n Six single probes are installed on the CV along the machine axis. These probes observe the floating potential.
n Their reference point is confinement vessel.
n The sample plot of this measurement is shown on the left figure (contour map). We have observed that the main floating potential (slow frequency) corresponds to the core plasma distribution in the machine axis.
n Also, the fluctuation signals are related to fluctuation on b-dot probes
 Z (cm)
-136
-80
-25
25
80
136
Theta (deg)
149
166
150
330
166
149
  Probe chip
Schematic drawing of the single probe
Time (ms)
Vf (V)
 Vacuum side
 Example: Distribution of the floating potential along the machine axis.
 nC-2W (Norman)
FRC formation section
Neutral beams
Confinement section
nInstability
EFRC: ; > 1, n=2 growth
n The field-reversed configuration plasma core rotates in ion-diamagnetic direction, leads to growth of rotational instability.
Major mode # of FRC
   Inner diverter
Outer diverter
FRC formation section
VDi
Bz EFRC VExB
FRC Core
Schematic of the rotational instabilities. Example plot of toroidal mode number n=2.
    EFRC
α = rotational parameter =
456 + 48×: 456
 Monde numbers
Frequency (kHz)
1
-10 kHz
2
- 20-40 kHz
   nCorrelation of global instabilities q Observation and comparison of two component rotation
q Density fluctuations generate electrostatic field q High frequency rotation and core plasma density profile
     n Comparison of two stable shots with high and low peak density
Abel-inverted density using FIR
#115173 #114534
  n Observation of n=2 mode using FIR system
#115173
   r (m)
n n=2 mode can be identified
using FWHM method
n n=1 does not change FWHM
Sample plot of the FIR signals at two different times.
n=2 mode
 n Components of azimuthal rotation from Mirnov probe data #115173
Split mode numbers
Find peaks Unwrap
$%⁄$&
 Low freq n=1 mode
Sample plot of Mirnov probe signal High and low-frequency components detectable
Sample plot of slow n=1 mode, white line shows the trajectory of the each peak
      n Density ratio between peak and center vs. high frequency rotating structure #115173 #114534
From this result
Ratio of density >0.6 Ratio of density <0.6
      Low freq mode Does not change speed Does not change speed
 Accelerates in opposite Decelerates and High freq rotation direction of slow mode changes direction of
rotation
  n Spectrograms of single and magnetic probes Single probe
Mirnov probe No n=2 mode
 n FIR and electrostatic probe observed n=2 mode behavior.
n N=2 mode on the magnetic probe does not exist.
n N=2 mode might be generating the electrostatic field around the core plasma
n=1 mode
n Slow n=1 mode and fast rotating structure
 +50(rad/ms) +50~+70(rad/ms) -300 ~ -500 (rad / ms)
Time (ms)
n The rotational speed of the low-frequency n=1 mode is 50 – 70 rad/ms n Once the low-frequency speed stabilizes, the high-frequency structure
accelerates in the opposite direction of the low-frequency n=1 mode.
n The high-frequency component rotates up to 10x faster than slow n=1 mode.
#115173
   n Conclusion
n Floating potential and magnetic field measurements have been adopted on the C-2W.
n Low and high frequency modes and rotating structures have been observed.
n The mirnov probe observed not only the low-frequency n=1 mode but also high-frequency rotating structure.
n The rotational speed of low-frequency mode is equivalent to previous C-2 FRCs, and its velocity is 50 – 70 rad/ms.
n The rotational speed of high-frequency structure is 10x faster than the slow component with velocity 300 – 500 rad/ms n The direction of the high-frequency rotation depends on the density gradient inside the separatrix.
q If the ratio of the density between peak and center of the core plasma is smaller than 0.6, the high-frequency rotation does not appear.
q If the ratio is higher than 0.6, then the rotation accelerates in opposite direction of the n=1 mode.
z(cm) rΔφ (m)
' (rad/ms) (low freq n=1 mode)
' (rad/ms) (high freq mode)
nedl (cm-2)
Degree
| 1 |
