
Page 3 - Jet outflow and open field line measurements on the C-2W advanced beam-driven field-reversed configuration plasma experiment
P. 3
10D120-3
Sheftman et al.
Rev. Sci. Instrum. 89, 10D120 (2018)
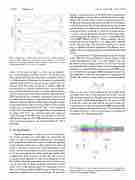
FIG. 4. Calibration of a MW interferometer module. (a) Raw I-Q signals obtained while aligning the interferometer with a reflector 4 m from the antenna. (b) I-Q signals obtained while blocking the output of the antenna with absorber material. (c) Corrected I-Q signals.
where c is the speed of light, ε0 is the vacuum permittiv-
ity, λ is the probing wavelength, and m is the electron mass.
The radial profile of the electron density can then be obtained
by Abel inversion. Calibration of each chord is performed by
applying one period of a sawtooth voltage signal to the syn-
thesizer, while the antenna is aimed at a reflector. Thus, the
interferometer is scanned in frequency space and an interfer-
ence pattern is obtained (see Fig. 4). A drift in the interference
signals can be noticed. This is due to multiple reflections of the
MW signal inside the waveguide components. This drift can
be corrected by blocking the outgoing beam with attenuating
material and subtracting the resulting signals from the total sig-
nal obtained with the reflector. Total sensitivity of the unit due
to phase noise is approximately 1012 cm−2 of line integrated
density. The interferometer is designed to measure densities in
10 12 −3
the range of 10 -10 cm . Densities above that range will
cause refraction of the MW beam and therefore are not suit- able for this diagnostic. The MW interferometer system has been tested in the laboratory and will be installed on C-2W at mid-2018.
C. Jet spectrometer
Doppler spectroscopy is used to measure the velocity pro- file of ions streaming out of the FRC core toward the end plates. A Princeton Instruments IsoPlane-320 spectrometer with astigmatism correction is used to obtain the spectrum of ion radiation at three lines of sight, which can be observed in Fig. 1. The light is collected by a retractable mirror located in the vacuum vessel at the mirror field location and transmit- ted to the spectrometer via a three chord fiber bundle, thus enabling three lines of view at a time. The main focus of research is on the abundant O4+ line of wavelength 278.1 nm. Nevertheless, the same spectrometer may also be used to mea- sure the spectrum of charge exchanged deuterium neutrals, which serve as the injection gas in the experiment (such as 486.1 nm). Photo-multiplier (PMT) arrays coupled to trans- impedance amplifiers are used for detection. To match the
32 mm × 7 mm form factor of the PMT arrays and maximize light throughput, a system of two cylindrical lenses is used to magnify the spectral output by a power of approximately 30 at the spectral (horizontal) dimension and about 10 in the spatial (vertical) dimension. Ray tracing simulations by Zemax show that the footprint of a point source located at the focal plane of the spectrometer is spread to <4 mm in the spatial dimen- sion and <1 mm in the spectral dimension at the image plane, easily fitting inside the respective 7 mm × 1 mm dimensions of each PMT channel (see Fig. 5). Thus, according to the sim- ulation, the spectral resolution is not significantly degraded by the optical system. The lenses are mounted on a linear stage, to optimize chromatic performance for different wave- lengths. Lab tests are being carried out to confirm the simulated results.
A main concern is UV light attenuation by the fiber optical cables. Therefore, the spectrometer is placed adjacent to the experimental apparatus, with a 15 m fiber bundle used. Two 64-channel analog to digital convertors (ADCs) are used for data acquisition and are placed inside an electro-magnetically shielded box, together with the optical system and PMT detec- tors. The ADC can reach up to 10 MHz sampling rate; however, the bandwidth is limited by the amplifiers to approximately 50 kHz. The velocity calculated from spectral measurements is
cλ −λ fit 0
v= λ , (3) 0
where λ0, λfit, and c are the emission line wavelength at the rest frame, the center of the measured line profile, and the light velocity, respectively. The spectrometer resolution at the exit slit, with a 3600 g/mm grating and a 20 μm slit width, is 0.019 nm, which fits well with the detector resolution of 0.02 nm based on 1 mm spacing between PMT channels. This improves upon the spectrometer used on C-2U to measure the jet outflow (see Ref. 4). The jet spectrometer is scheduled to be installed on C-2W in spring 2018.
FIG. 5. Illustration of a ray tracing simulation for the two cylindrical lens optical system used to image the jet spectrometer output onto the PMT arrays and the corresponding spot diagrams.
