
Page 2 - Characterization and calibration of the Thomson scattering diagnostic suite for the C-2W field-reversed configuration experiment
P. 2
Nucl. Fusion 58 (2018) 126026
detailed experimental data of micro-bursts are described. In section 3 existing theories are found to explain some of the experimental data, and a heuristic model is proposed to explain the observed micro-burst characteristics which are not explained by the existing theoretical work.
2. Experimental data
C-2U is an upgrade of the C-2 FRC experiment in which the FRC plasmas are created in two formation quartz tubes which are axially separated (in the north-south direction) by the con- finement vessel (CV) in the middle [2–5]. The plasmas are then accelerated to a speed of over 200 km s−1 and translated into the CV, where a head-on collision occurs and the kinetic energy is converted into plasma thermal energy. In about 0.1ms, the dynamic collision process settles down and the plasma is relaxed to its equilibrium state.
After the collision and merging process the FRC plasma is sustained by six advanced neutral beams with adjustable beam energy from 8 to 15 keV and a total power up to 10 MW. Three beams are installed 0.5 m to the north of the CV mid-plane with an injection angle of 70degrees with respect to the CV axis, slightly pointing south, while the other three beams are installed to the south, mirroring the north beams with respect to the CV mid-plane. All beams are tangentially injected with a radial impact parameter of 0.19 m, such that the beam particles travel in the ion diamagnetic rotation direction. Injected fast ions are an important factor in stabilizing the classical n = 1 and 2 FRC instabilities via finite Larmor radius effects [6]. In combination with edge biasing methods, the n = 1 and 2 insta- bilities are stabilized, leading to high performance FRC (HPF) plasmas [2–6]. The suppression of classical FRC instabilities results in up to an order of magnitude improvement in some of the intrinsic confinement times, so that the plasma lifetime is extended to beyond 10 ms, limited by the NBI duration.
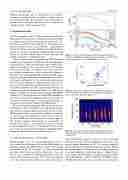
The good confinement properties allow the fast ion pressure to build up to a level comparable to the bulk plasma pressure [2], such that new physics phenomena emerge. In some of these HPF plasma discharges, periodic small amplitude micro-bursts are observed by several diagnostics, most clearly seen by the far infrared (FIR) laser interferometer [7] as shown in figure 1. The detailed temporal characteristics of micro-bursts are described in section 2.1; the spatial mode structure of micro- bursts is examined in section 2.2; the correlation between fast ion energy and the micro-bursts and the equilibrium profile change over micro-bursts are presented in section 2.3.
2.1. Temporal characteristics of micro-bursts
Shown in figure 1(a) is the excluded flux radius (rΔΦ) of a micro-burst affected discharge. The excluded flux radius is an important characteristic FRC parameter related to the plasma diamagnetic current [8]. It shows step drops with smaller step sizes earlier in time and clearly evident after ~5 ms, each step in rΔΦ is correlated to a bursting fluctuation in the line integral densities shown in figure 1(b). Detailed examination of the line integral density data for the central chord (0cm)
B.H. Deng et al
Figure 1. In some high performance FRC plasma discharges in C-2U the excluded flux radius (a) shows step drops, correlated with periodic micro-bursts in the FIR interferometer data (b).
Figure 2. Micro-burst amplitude (δn0, defined in equation (1)) versus burst interval during the exponentially growing phase (1– 6 ms) of the micro-burst (see figure 13).
Figure 3. Spectrogram of micro-bursts showing fast frequency down-chirping. The color represents the fluctuation power in arbitrary unit.
shows that the bursts appear as early as ~0.7ms with a burst interval of ~0.12 ms and a peak amplitude of the relative line integral density fluctuation of 1%. The bursting amplitude exponentially grows to about 6 ms and then saturates. During this growing phase, the burst interval is linearly proportional to the burst amplitude, as shown in figure 2. Simple Fourier spectrogram is shown in figure 3. It appears as discrete bursts with peak frequency of about 75kHz and a FWHM of about 100 kHz. However if the x-axis is stretched out, it shows that
2
