
Page 3 - Characterization and calibration of the Thomson scattering diagnostic suite for the C-2W field-reversed configuration experiment
P. 3
Nucl. Fusion 58 (2018) 126026
B.H. Deng et al
Figure 4. Interferometer chirplet waveform (solid curve) fitted to the chirplet model (dashed curve) of growing/decaying sinusoidal oscillation before/after the peak with model parameters of
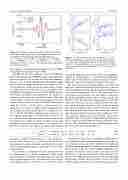
Figure 5. (a). Micro-burst growth rate normalized by ωp = 2πfp where f is the frequency at peak. (b) Decay rate normalized by
tp = 4.2955 ms, fp = 82.25 kHz, γ = 126.3 kHz, β = 121.3 kHz,
−1 −1 p
rch1 = −2820 kHz ms , rch2 = −452.3 kHz ms , φ0 = −1.8405 ω . (c) Frequency chirping rate before t . (d) Frequency chirping 19−2 p p
rad and δn0 = 0.1153 × 10 m . The peak time (tp) is indicated by the vertical dashed line.
the frequency of each micro-burst begins at about 150kHz, then quickly down-chirps to below 50 kHz.
The FIR raw data were sampled at a rate of 15 MHz and filtered with a bandwidth of 500 kHz or higher, the digitization process is adequate for resolving the micro-burst dynamics. However, since the down chirping rate of micro-bursts is high and the frequency changes significantly even within one cycle of the oscillation, a Fourier transform, which usually requires averaging over several oscillation cycles, is not a good tool for analysing the bursting process. Instead, time domain analysis with chirplet modelling is more appropriate. The details of a typical micro-burst time trace are shown in figure 4. The solid curve in figure 4 represents the fluctuation signal of the line integral density measured by the central FIR interferometer chord δn ≡ ´ nedl − ´ nedl: where ⟨⟩ represents time aver- aging. It is seen that the oscillation starts at high frequency of >150 kHz and down chirps quickly to <50 kHz in a few cycles, and the fluctuation amplitude grows and decays as the frequency down chirps. It is found that this process can be well fitted to the following chirplet model as indicated by the dashed curve in figure 4: where δn0 and fp are the peak amplitude and frequency at peak time t = tp in equation (1). Before the peak time tp the chirp is an exponentially growing
δn=® δn0eγ(t−tp)cos{2π[fp +rch1(t−tp)](t−tp)+φ0}, (ttp),
rate after tp. The straight lines in (a)–(d) are linear fits to the data, with the coefficients of determination of 0.65, 0.18, 0.58, and 0.21, respectively.
rate and the chirp rate scale linearly with the peak amplitude, while in the decaying phase (t > tp) this linear relationship is mostly lost as indicated by the small coefficients of determi- nation (R2 values) for the linear fits in figures 5(b) and (d).
The peak frequency fp is plotted in figure 6. Also plotted in figure 6 is 2 times the plasma rigid rotor frequency 2frr derived from 1D equilibrium solution based on rigid rotor assumption and measured density profile data [7]. The plasma rigid rota- tion frequency barely changes over time from 1 to 6 ms when the plasma equilibrium profile evolves slowly, and spins up from 6 to 8ms. The micro-burst peak frequency tracks this trend. The error bars for 2frr are not plotted, however the rela- tive error in the density profile data used to derive the plasma rigid rotation frequency is about 10 to 20%. Therefore, figure 6 shows that the peak frequency fp of micro-bursts agrees with 2 times the plasma rigid rotor frequency 2frr to within error bars. This agreement suggests that the micro-bursts will grow in amplitude when the frequency is high until it down-chirps to about 2 times the plasma rotation frequency, and then it starts to decay. This observation also agrees with Finn and Sudan’s theory as will be discussed in section 3.2
(1a) δn0e−β(t−tp) cos {2π [fp + rch2 (t − tp)] (t − tp) + φ0}, (t > tp) . (1b)
sinusoidal oscillation with growth rate γ and varying fre- A side note on classical n = 2 instability in FRC plasmas: quency with a chirp rate of rch1, after the peak time it is an It is traditionally called rotational instability as plasma spin up
exponentially decaying sinusoidal oscillation with a decay rate of β and frequency chirp rate of rch2, and φ0 is the phase at the peak time.
For each burst, a set of parameters can be obtained from the best chirplet curve fit as defined in equation (1). The growth and decay rates, the chirping rates before and after the peak time are plotted in figures 5(a)–(d), respectively. It is seen that in the growing phase of the bursts (t < tp) both the growth
was considered as the cause of the instability. One hypothesis to explain plasma spin up is due to particle loss, the remaining plasma needs to spin up to satisfy angular momentum con- servation [1]. Detailed density profile data analysis shows that from 1 to 4ms, the total particle number inventory loss is about 50% while no plasma spin up is observed, falsifying the hypothesis. Plasma spin up or down is closely correlated with the change in the plasma’s moment of inertia per particle
3
