
Page 6 - Detection and prediction of a beam-driven mode in field-reversed configuration plasma with recurrent neural networks
P. 6
Nucl. Fusion 60 (2020) 126025
C. Scott et al
each type of diagnostic separately. Convolution was con- strained to happen only along the time axis by making the con- volutional kernels size 1 × k (several values of k were tried, i.e. 2,4,5). This construction is in line with prior work using CNNs to analyze time-based signals, as in [22]. The final out- put of each of these separate convolutional pyramids was then concatenated into one vector. This vector was then fed into a fully-connected network with three layers. We tried many dif- ferent layer sizes for the final layer(s); however, this approach was largely unsuccessful, failing to achieve above 65% accur- acy on the held-out validation dataset.
3.2.2. Convolutionofmergeddiagnostics. Inadditiontothe convolutional model explained above, we tried a more tradi- tional convolutional network approach where the input dia- gnostics were concatenated into a 2D image, and several con- volutional filtering layers extracted successively higher-level features from this image. This approach was similarly inef- fective, and in fact the network failed to converge even on the training dataset, for many different choices of hyperparamet- ers e.g. learning rate and kernel size.
3.2.3. Recurrent neural networks. Given the sequential nature of our data, and the fact that we were searching for pat- terns that occur at particular time locations, recurrent neural networks seemed to be a natural fit. We follow the example of previous work applying RNNs to high-energy plasma exper- iments, e.g. [1, 3, 23]. In our first-pass implementation of an RNN, we treated each data element as a temporal sequence of readings from our set of 360 probes (PCAed to 270 inputs). A basic RNN with a single hidden layer of 200 nodes and 50% dropout at the final layer immediately showed encour- aging results (achieving 75% accuracy very early in training). We took this to indicate that a more advanced form of RNN might improve accuracy further. In the following subsection we detail the LSTM model we used, which showed improved performance over the models discussed in this subsection.
3.3. LSTMs
In particular, we achieved best results on this classification task with an LSTM network. Previous work has found that LSTM networks tend to perform well in circumstances like this one, where the phenomenon of interest occurs at variable locations within each sequence of data. Specifically, LSTMs have been widely used in anomaly detection [24], especially anomaly detection in data originating in multiple sensors [25]. Recurrent neural networks in general have been used to dia- gnose and detect other types of plasma instability [1, 26, 27].
Our network used a four-layer LSTM module with 235 hid- den nodes in each layer and a forget-bias of 1.0, as is standard. There was no dropout between LSTM layers or between tem- poral sequence steps, but we utilized 25% dropout between the final hidden state and the output of the network. As can be seen in figure 4, this dropout layer did not fully prevent the model from overfitting: the model is performing far better (in terms of mean squared error) on the training set than the validation
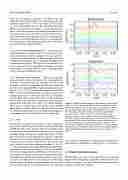
Signals from both magnetic and bolometry probes during a staircase event, expressed in arbitrary units as a function of time. Within each subplot, each line represents the reading of one probe. As a visual aid, long-term trends in each signal have been removed by subtracting each signal’s average over the time period which precedes staircase onset (5.2 ms≤t ≤ 5.25 ms), and traces are staggered evenly over the y-axis (making vertical units arbitrary). The vertical line in each subplot represents the onset of the staircase phenomenon. We see that overall the precursor oscillations are not as clear on bolometers as on the magnetic probes. However, both signals show a qualitative difference in behavior, as compared to the period before the vertical line. These probes are distributed radially about and longitudinally along the main axis of the machine; see figure 6.
set. As a subject of future work, we propose increasing the size of the dataset to diminish this overfitting effect - see section 6.
4. Variable importance analysis
With LSTMs as our choice of network structure, we can then analyze which of our plasma diagnostics (of those described in section 2 and figure 7) are most critical for detecting staircase instability. We do this as follows:
6
Figure 5.
