
Bondarenko-APS-DPP-2020-poster-final
P. 1
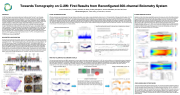
 Towards Tomography on C-2W: First Results from Reconfigured 300-channel Bolometry System
Anton Bondarenko, Timothy DeHaas, Ian Alfrey, Andrey Korepanov, Andrew Alexander, and the TAE Team
     ABSTRACT
In TAE Technologies' current experimental device, C-2W (also called ”Norman’’)1, record breaking, advanced beam-driven field reversed configuration (FRC) plasmas are produced and sustained in steady state utilizing variable energy neutral beams (15 - 40 keV, total power up to 20 MW), expander divertors, end bias electrodes, and an active plasma control system. Tomography offers a valuable and non-invasive diagnostic of the FRC plasma, as tomographic reconstructions of the emission profile yield important information on plasma shape, density, transient MHD behavior, and power loss due to radiation and particle flux. Recently, a bolometer system on the C-2W device has been reconfigured with the primary goal of providing tomographic reconstructions of the FRC. The overhauled system consists of 300 photodiode channels with unique lines of sight that intersect a toroidal plane of the FRC near the mid-plane. The photodiodes respond to a broad range of wavelengths from XUV to NIR as well as energetic particles. In addition, thin metallic optical filters on roughly one-third of the channels allow for coarse spectral resolution. First data acquired via a new low-noise grounding-shielding scheme, which presently allows for simultaneous digitization of 16 channels, indicates a hollow cylindrical plasma within the separatrix radius, consistent with expected structure of an FRC. Line-integrated emissivity values up to ~4 × 10⁵ W / m2 are observed.
1H. Gota et al, Nucl. Fusion 59, 112009 (2019) BOLOMETER CONFIGURATION
The recently overhauled bolometry system consists of 3 CF vacuum flanges, each housing 5 Opto-Diode AXUV20ELG 20-channel silicon photodiode detectors. The detectors respond to a broad range of photon wavelengths (~10 nm – 1100 nm) and energetic particles with a typical photo-current responsivity of ~10-1 A / W. On each bolometer flange, 3 of the detectors are unfiltered, 1 is molybdenum-filtered, and 1 is aluminum filtered, allowing for coarse spectral resolution as well as discrimination between particles and photons. Small apertures positioned at various offsets with respect to the detector chips create distinct views for the different channels. In total, the system provides 180 unfiltered channels, 60 molybdenum- filtered channels, and 60 aluminum-filtered channels that create 180 unique view chords intersecting a toroidal plane at 26 cm from the mid-plane of the C-2W machine. In the present work, photo-currents are converted to photo-voltages passively via a 22 kΩ shunt resistor PCB board connected to the bolometer flanges, and the photo-voltages are digitized via a 16-channel, 5 MHz, high-Z custom DAQ system.
TAE Technologies, Inc., 19631 Pauling, Foothill Ranch, CA 92610
When the bolometers were first deployed in their new mid-plane configuration, severe noise on every photo-detector channel (up to ~10 V) made detection of the expected photo-signal (~100 mV)
impossible. A detailed investigation determined that the primary source of noise was capacitive coupling from the confinement vessel wall, which can develop high-frequency (> 250 kHz), large amplitude (~100 V) voltages during plasma shots. In the original grounding-shielding scheme, shielded signals were digitized inside of a grounded screen room. Due to the unique photo-detector design (20 cathodes that share the same anode), differences in cathode and anode capacitive coupling to vessel and ground created a differential noise voltage at the digitizer. The noise problem was resolved by digitizing the signals near the vessel and shorting the anode to the vessel wall via a robust shield that enclosed the entire cable and shunt resistor PCB. In this new scheme, both the cathode and anode fluctuate at the vessel wall voltage, allowing only the photo-signal to create a differential voltage at the digitizer. Noise levels have been reduced to ~20 mV or less, allowing for the detection of clear photo-signals on all tested channels.
original grounding-shielding scheme:
low-noise grounding-shielding scheme:
RAW AND CALIBRATED BOLOMETER SIGNALS
EachrawbolometersignaltimetraceS(t)isinterpretedasthevolumeintegraloftheplasmaemissivityfunction!",$ (inW/m3)overthecollectionconeofthatparticularchannel,weightedby the solid angle fraction spanned by the detector-aperture system with respect to each volume element. Multiplication by an effective calibration constant c containing the amplification, detector responsivity, filter transmittance, etc. yields the voltage measured on the digitizer. For tomographic reconstructions, S(t) must be calibrated into a line integral of the emissivity fL(t) (in W / m2) along the collection cone axis. In calculating fL(t), the effective solid angle is evaluated numerically to take masking effects into account, which are significant in this system due to the comparable size of the aperture and detector. Typical raw photo-signals of ~100 mV indicate line-integrated emissivities of ~105 W / m2.
PLASMA EMISSION PROFILE
Calibrated, smoothed bolometer signals fL(t) measured on 32 unique view chords (32 unfiltered channels and 16 overlapping aluminum-filtered channels) are compiled into contours showing the line-integrated emissivity as a function of time and view chord impact parameter. Since only 16 channels could be digitized simultaneously in the new low-noise scheme at the time of this work, each contour represents a different, though mostly reproducible, plasma shot. Qualitatively, the contours reveal a hollow cylindrical plasma structure with a particularly emissive shell within the maximum separatrix radius RS (line- integrated emissivity values up to ~4 × 10⁵ W / m2). The aluminum-filtered views also indicate sufficiently hot plasma temperatures inside RS to produce XUV emission at wavelengths below 100 nm. A lineout of the aluminum-filtered profile suggests that peak emission occurs near the estimated null radius R0, consistent with the expected structure of an FRC plasma.
NOISE TROUBLESHOOTING
 capacitive coupling model accounts for observed noise in original and new schemes:
Assuming measured noise voltages smaller than the forward threshold diode voltage (~0.5 V) and no photo-current, the equivalent circuit for the original grounding-shielding scheme yields:
(realistic estimate)
In the new grounding-shielding scheme, shorting the anode to the vessel, getting rid of the connection to the screen room wall, and shielding the cathode with a shield at the anode potential thus eliminates capacitively coupled noise:
                  C-2W Parameters
  BEXT
RS
LS
ne
Ttot = Ti + Te pulse length
~ 0.1 - 0.3 T
~ 40 cm 2–3m
(1-3) × 1019 m-3 up to 3 keV
up to 30 ms
example of raw signals S(t) in V:
raw signals: Bolometer CV026S189 - Slot 2 - Shot 123444
proper treatment of solid angle:
example of calibrated signals fL(t) in W / m2:
cal. signals: Bolometer CV026S189 - Slot 2 - Shot 123444
mov. avg. (2.5 ms)
      calculation of calibrated signal:
Assumingthattheemissivity!",$ doesnotvarysignificantlyover the cross-section of the collection cone and making use of conservation of etendue, the volume integral corresponding to the raw signal S(t) easily separates into an emissivity line integral and a solid angle fraction area integral, yielding the calibrated signal fL(t):
  CONCLUSIONS AND FUTURE WORK
A recently reconfigured 300-channel bolometry system on C-2W has successfully collected first data in a new low-noise grounding-shielding scheme. Preliminary analysis reveals that the present C-2W plasmas are characterized by a hollow cylindrical structure with line-integrated emissivity up to ~4 × 10⁵ W / m2 within the separatrix radius. The most pertinent next step is to implement the new low-noise scheme for all 300 channels, such that all photo-signals can be simultaneously digitized. Once operational, this system willallowfortomographicreconstructionofthenear-midplaneplasmaemissivityfunction!",$ after every plasma shot. In addition, frequency spectrum analysis of the collected photo-signals will diagnose MHD instabilities.
| 1 |
