
Page 2 - Demo
P. 2
activity.
In space plasmas, examples abound of fast ion driven waves
energizing particles. Solar wind driven reconnection on the
day side of the Earth’s magnetopause can set off reconnection
in the magnetotail. The resulting high energy plasma flows
along the magnetospheric flux tubes towards the Earth’s mag-
netic poles and becomes mirror-trapped in the near-Earth re-
gion. As these fast ions approach the mirror, their motion
becomes predominantly perpendicular to the magnetic field
(strikingly similar to the geometry in Figure 1) and they excite
1010
109
108
107
100 80 60 40 20
measured
thermonuclear
ion cyclotron waves which damp on background plasma ions 0
and cause aural arc brightening. A similar phenomenon occurs in the corona of the sun, where reconnection creates fast ions15 which then interact with the plasma, driving waves and accelerating particles which generate x-rays at the base of coronal loops in a process known as coronal loop feet brightening.16,17
In terrestrial (non-MFE) laboratory plasmas, a prominent example of particle energization from a beam-driven mode does exist. In wakefield acceleration,18,19 a high intensity laser pulse (or beamlet of particles) in a plasma creates a high phase velocity plasma wave with a very large ordered electric field which accelerates plasma electrons to high energies over small distances (e.g., 1 GeV/cm). In the present case, the wave is thought to be the ion Bernstein wave, not a plasma oscilla- tion, and the coupling is to ions rather than electrons. But, as in the wakefield case, the high phase velocity of the driven wave is critical to accelerating particles to high energies while simultaneously avoiding destructive interaction with the bulk plasma.
In this Article we present a collection of experimental ob- servations, including magnetic field and density fluctuations and the fusion enhancement. An electromagnetic particle-in- cell (PIC) simulation in a simplified geometry is used to iden- tity the possible mode and connections are made to both the experimental observations and analytic theory. Finally, a dedi- cated experiment is conducted which illustrates how the mode can be controlled by manipulation of the free energy source.
OBSERVATIONS
2.45 MeV neutrons are one product of the deuterium- deuterium fusion reaction. The fusion rate of the plasma de- pends on the densities of the reactants and the reaction cross section integrated over the energy distributions of the react- ing particles. The detectors are plastic scintillators coupled to photomultiplier tubes located close to the vessel wall on the atmosphere side. They are absolutely calibrated with an AmBe source.20 The FRC plasma is pure deuterium while the neutral beams are pure hydrogen. There is therefore no beam- plasma component to the neutron production, and neutrons are produced only due to fusion reactions between plasma ions themselves. That the beams are deuterium-free is confirmed experimentally by firing the beams into the deuterated vessel wall and measuring zero neutron signal.
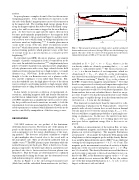
Shown in Figure 2 is the shot-averaged measured rate (black line) and the calculated thermonuclear rate (red line),
t (ms)
FIG. 2. The measured neutron rate (black curve) and the calculated thermonuclear rate (red curve) diverge 200 μs into the discharge (top panel). The ratio of the two curves (bottom panel) shows the fusion enhancement peaks at 100x at 3.5 ms into the discharge.
calculatedasR = 1n2 < σv > V ,wheren isthe 2i FRC i
ion density, which we obtain by assuming that ni ∼ ne and measure ne with interferometry.21 The fusion reaction rate, < σv > is a known function of ion temperature, which we obtain from Ti = Ttot − Te, where Ttot is the total tempera- ture derived from radial pressure balance and Te is measured with Thomson scattering.22 Finally, VF RC is the volume of the FRC obtained from magnetic measurements.23 Note that the above expressions for density and temperature neglect fast ion pressure, which can be significant. However, inclusion of the fast ion pressure would lower both derived quantities. The thermonuclear fusion rate calculated here is therefore an up- per limit. It can be seen that the measured neutron rate (black curve) begins to rapidly diverge from the thermonuclear rate (red curve) at ∼ 0.2 ms into the discharge.
This timescale is much faster than the timescale for colli- sional heating of plasma ions by beam particles. A fast test particle with velocity between the ion and electron thermal velocity must slow to below the critical energy, Ecrit ≈ 15Te, before it will have a significant probability of pitch angle scat- tering on plasma ions. In this case, the injected ions have, Efi = 10Ecrit and therefore 2-3 e-folding times (6-9 ms) must pass before significant energy flow to the ions is ex- pected.
In addition to measurements of the neutron flux, we mea- sure intermittent magnetic and density fluctuations near the plasma ion cyclotron frequency. The magnetic fluctuations are measured ∼ 10 cm inside the wall in the SOL plasma with a high time resolution magnetic probe and the density fluctua- tions with Far Infrared Interferometry (FIR)24 from 4 different viewing chords (impact parameters r = 0, 15, 30, 45 cm). The magnetic probe measurements reveal mode activity at higher harmonics of the ion cyclotron frequency, up to n = 15 (Fig- ure 3, bottom left). The density fluctuations reveal that there is an electrostatic component to the mode and that it is not con- fined to the FRC, as the fluctuations appear on the r = 45 cm chord, which does not intersect the FRC. In fact, the relative size of the line-integrated fluctuations (i.e., δ ndl/ ndl) is largest on this most-outboard chord.
10–14 01234
2
fusion enhancement fusion rate (s-1)
