
Page 4 - Demo
P. 4
4
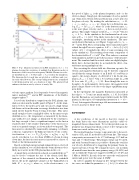
FIG. 5. Top: Dispersion relation from PIC simulation of β = 0.1 plasma showing the excitation of multiple Ion Bernstein modes at harmonics of the ion cyclotron frequency. Middle: Plasma ion veloc- ity distributions at t = 0 (blue) and t = 8 μs (red) in the simulation. The Gaussian fits for each time are plotted as solid lines and over- lay each other. Bottom: The corresponding neutron rate, normalized to the thermonuclear rate, as a function of time. The generated tail enhances the fusion rate by a factor of nearly 30x.
velocity space gradient. It is frequently observed in magnetic mirror machines30,31 and in PIC simulations of the Earth’s magnetosphere.32
Ion velocity distribution output from the SOL plasma sim- ulation is shown in the middle panel of Figure 5. As the simu- lation evolves, the modes grow and one can see a high energy tail drawn out from the main ion energy distribution in a time much shorter than the beam slowing down time. This tail is small enough to have a negligible effect on the macroscopic distribution (i.e., the temperature as measured by the Gaus- sian width does not change, as illustrated by the solid lines), but large enough to have a significant impact on the fusion reactivity (due to the sensitive dependence of the fusion cross section on particle energy), as shown in the bottom panel. The fusion rate is calculated by numerically summing over binary collisions, equivalent to the Klimontovich two-body correla- tion function, < σv >= Σi̸=j Σj σ(|vi = vj|)|vi = vj|. It can be seen that in 8 μs, less than 1/100th of a beam slowing down time, the fusion reaction rate is increased by a factor of 30 above the thermonuclear rate.
Based on the high energy tail and enhanced fusion observed in this simulation, we conclude that the beam driven mode is likely more active in the SOL plasma than in the core.
A simple but powerful criterion based on wakefield theory18 can be used to estimate the size of the electric field fluc- tuations of the saturated ion Bernstein mode. In wakefield theory, the mode amplitude saturates at the Tajima-Dawson field, E = mecωp/e, where me is the electron mass, c is
the speed of light, ωp is the plasma frequency, and e is the electron charge. Simply put, the maximum velocity a particle can obtain from electric field acceleration in a wave period is the phase velocity. By making the substitutions me → M, c → vφ, and ωp → ωc,i we obtain the ion Bernstein ana- log, Esat = Mvφωc,i/e, where M is the deuteron mass, vφ is the wave phase velocity, and ωc,i is the ion cyclotron fre- quency. This simple estimate yields Esat = 3.6x10⁵ V/m for vφ = 0.5vb. In the simulation, the fundamental mode satu- rates at Esat = 1.6x10⁵ V/m, likely lower due to the presence of multiple, interfering modes in the simulation. The mea- sured density fluctuations (see Figure 3) approach δne/ne ∼ 10−4 in the SOL. The corresponding electrostatic field can be related through Poisson’s equation, ikE = −4πδne(k)/ε(k) (where ε(k) = 20 includes the effect of ionic screening seen in the simulation). The resulting electrostatic component of the electric field is E = 6x10⁴ V/m. This value is consistent with simulation and theory given the accuracy of the measure- ment. The simulated and theoretical values are slightly higher, likely due to the fact that they do not include the effect of in- terference among multiple modes.
By converting the electric field into Gaussian cgs units, the electric and magnetic fluctuations can be directly compared (recall that the energy density of an E field of 1 statV/cm is equal to the energy density of a B field of 1 G). In the sim- ulation, Esat = 1.6x10⁵ V/m = 5.3 statV/cm while Bsat=50 G, for a ratio Esat/Bsat ∼ 1/10. Even though the wave is thought to be predominately electrostatic, the magnetic field plays a larger relative role due to the larger equilibrium mag- netic field.
In the experiment, the magnetic fluctuations measured at the edge (r = 70 cm) are much smaller, ≤ 1 G. It is likely that the fluctuations are much larger further inside the SOL plasma, in the region of beam-plasma interaction (r = 40 − 50 cm), but magnetic fluctuation profile measurements remain for now an area for future work.
EXPERIMENT
A key prediction of the model is that free energy in the beam drives the wave fluctuations and the orders-of- magnitude fusion enhancement. To test this prediction an ex- periment was designed in which a source of free energy in the beam was varied, in this case ∂f/∂v.
The neutral beam has 3 energy components due to the accel- eration of H2 and H3 molecules in the beam line. The energy components are measured to be 85% full energy, 10% half en- ergy, and 5% third energy. The primary energy can be varied, and with 5 neutral beams it is possible to flatten the total fast ion velocity distribution by staggering the primary beam en- ergy from beam to beam. We compared 2 cases, one in which all neutral beams have the same primary energy (14.4 kV) and one in which the beams are staggered (2 NBs at 11.5 kV and 3 NBs at 16.0 kV). In each of the two cases the total injected current and power were the same, 6.8 MW.
In order to quantify the change in free energy between the two cases, we define the parameter α = dv∂f/∂v where the
