
Measurement of ExB Drift of Impurities in the C-2W Inner DivertorUsing Spatial Heterodyne Spectroscopy
P. 1
Measurements of impurity ion temperature and velocity distributions via active charge-exchange recombination spectroscopy in C-2W
Marcel Nations, Deepak Gupta, James Sweeney, Luis Frausto, Matt Tobin and the TAE Team
TAE Technologies, Inc., 19631 Pauling, Foothill Ranch, CA 92610
Motivation
Edge biasing in TAE’s field-reversed configuration (FRC) C-2W device
qEdge biasing of annular electrodes in the divertor region is routinely utilized as a boundary control technique to stabilize the FRC in the confinement vessel (CV).[1] The potential difference between open-field lines in the scrape-off-layer (SOL) creates a local radial electric field near the FRC separatrix and, consequently, E×B shear flow
Optical alignment and synchronization w/ DNB
Impurity charge-exchange line selection
Impurity-ion velocity and temperature profiles
qImpurity-ion azimuthal velocities directly inferred from the measured Doppler shift of modeled charge-exchange emission lines
qGoal: Maximize charge-exchange signal q DNB is out-of-plane relative to optical ports
• zDNB = +15.2 cm; zChERS = +24.0 cm qCompounded angle: tilt and clocking
q Repurposed optical mounts used Bremsstrahlung and Da PMT diagnostics qUltra-fine tilt adjustment capability with linear actuator design
Optical mount with tilting mechanism
q Correlation algorithm used to identify potential charge- exchange lines from neutral beam termination experiments (SpectrumID)
• Candidate lines: 528.8, 343.4, 313.9, 619.8, 566.6, 560, 449.6, 381, etc (units in nm)
q Survey spectrometers were synchronized with DNB
• 1.2 ms integration time
q Shot and frame averaging to
improve SNR
q Time window: t ~10-24 ms q Chosen line à 343.4 nm
Survey spectrometer UV-VIS spectrum
for
343.4
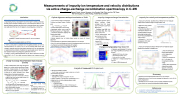
qRigid-rotor velocity profiles inside separatrix (Rs) qImpurities rotate faster in the e-diamagnetic direction with increasing negative electrode bias voltage (stronger radial electric field across biased field lines in the SOL)
qEstimated Er ~ - 3 to 7 kV/m near separatrix from radial momentum balance
O5+ azimuthal velocity profile vs. bias voltage Negative Biasing
End Biasing in C-2W
FRC SOL
343.4
• Translate 𝝓(𝒓) along 𝑩-field lines to create 𝑬(𝒓) at the FRC plasma edge
• Biasing controls plasma rotation via 𝒋𝒓×𝑩 force
Estimates of radial electric field from impurity properties and dynamics
qThere is a strong need to understand how the applied potentials vary from the electrode surface to the center of the CV and the resulting radial electric field Changes in potential along field lines (sheath, pre-sheath, etc.) can vary depending on plasma/machine conditions. This affects the resulting radial electric field in the SOL needed for rotation and, consequently, stabilization of the FRC
qProfiles of impurity rotation/temperature can be used to determine the radial electric field in the CV from radial momentum balance. Local measurements are critical
Charge-Exchange Recombination Spectroscopy
• 0.0001 degree tilt resolution
qRemote operation due to limited physical access to mounts for manual
adjustment
qControlled beam-into-gas shots for optical alignment in the machine
qScan in tilt and clocking angle and maximize total signal strength for all channels
qFueling piezo valves and DNB operating with hydrogen
qSpectrometer set to monitor Hb emission near 486 nm Total (all channels) frequency-integrated Hb signal
Beam-into-gas alignment w/ full DNB modulation @ 1 Khz (Hb)
528.8
619.8
Charge-exchange signal near 343.4 nm
qImpurity-ion temperatures directly inferred from the measured Doppler broadening of modeled CX emission lines
Emission spectrum @ 343.4 nm
DNB OFF
DNB ON
q Diagnostic uses high speed CCD camera
and image intensifier synchronized with
the DNB
• Dispersion: 0.0075nm/px (8 km/s/px) • Inst. Broadening: 0.035nm (43 eV)
• 16 channels, 2 per line-of-sight
qTargeted O-VI charge-exchange line at 343.4 nm
qCX signal ~5-8% of background
Fitting of measured O-VI emission near 343.4 nm
O5+ temperature profile vs. bias voltage
qNearly flat temperature profiles inside separatrix (within measurement uncertainty)
q Impurity-ion temperature (0.2 – 1.1 keV) rises with increasing electrode bias voltage
qSlightly higher temperatures measured just outside separatrix (ExB heating mechanism in the SOL)
DNB ON
DNB OFF
(ChERS)
qPassive measurements probe large background signals from multiple sources (e.g., electron-impact excitation, charge-exchange with heating beams and cold neutrals)àspatially convoluted emission qChERS is an “active” technique which yields measurements of local plasma properties
• A diagnostic neutral beam (DNB) is used to stimulate emission as fast neutral particles charge-exchange with plasma ions along its trajectory
C-2W Confinement Vessel (A-plane cross-section)
Optical Mounts
DNB
Analysis of measured O-VI spectrum
𝑯𝟎 + 𝒁&𝒏 𝒇𝒂𝒔𝒕
𝑯𝟎 𝒇𝒂𝒔𝒕
𝑪𝒉𝑬𝒙
𝑯& + 𝒁&𝒏,𝟏(∗) 𝒇𝒂𝒔𝒕
(impurity-ions)
(main-ions)
qFirst active iChERS measurements carried out on C-2W (Norman)
qSubstantial amount of work done to repurpose the diagnostic to work with the recently installed DNB
qIdentified the 343.4 nm line as (currently) the best candidate for iChERS
qLocal impurity-ion velocity and temperature profiles measured
Impurity ChERS in C-2W
• Two optical mounts, multiple chords
• Ø1” lenses, 600 μm fibers (0.22 NA)
• Full modulation of DNB at 1 kHz
• DNB operated with H/D (40 keV, 8
A)
* For main-ion ChERS measurements in C-2W, see poster by Gupta et. al.
[2] • Radial coverage up to r ~ 73 cm
+ 𝑫&
𝑪𝒉𝑬𝒙
𝑯& 𝒇𝒂𝒔𝒕
+ 𝑫𝟎(∗)
q Background emission (DNB off):
• Electron impact excitation and charge exchange due to heating
neutral beams and cold neutrals)
q Total emission (DNB on):
• Added signal from charge-exchange of O6+ with DNB
qRelative intensity of fine structure components for O-VI emission at 343.4 nm from collisional-radiative model
q Fitting procedure:
1. Fit background signal
2. Add charge-exchange (CX) model to fitted background
3. Iterate over Doppler width and shift of CX model for best fit
with total measured signal
Fine-structure model for O-VI emission near 343.3 nm
Summary
• Local ion parameters, such as temperature and velocity, can be readily extracted from the width and shift of the beam-induced emission line shape
• Added degree of control (signal level and temporal resolution) with DNB modulation
1. 2.
References
H. Gota et al., Nuclear. Fusion 59, 112009 (2019)
Gupta et. al. , « Main-ion Charge Exchange Recombination Spectroscopy in C- 2W FRC Plasmas » (these proceedings)
| 1 |
