
2020_HTPD_Titus_Calorimeter_v7
P. 1
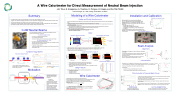
 Summary
1
• Four static beams (15 keV) and four tunable beams (15-40 keV) are currently operational on C-2W
• A tungsten wire calorimeter was designed with the help of a two-dimensional heat transfer model to measure injected neutral beam power
• Eight wire calorimeters were built, installed, and are currently in operation on every C-2W shot
• A measurement of average injected neutral beam power increases our knowledge and analysis of beam alignment, beam neutralization, time-dependent injected neutral beam power, and time-dependent captured neutral beam power
Calibration to Measured Energy
Beam
x-position (arb.)
x-position (arb.)
Neutralization
15 kV
40 kV
-1 kV
24 kV
0 V
-1 kV
0 V
0 V
600
0
-0.4
Ion Source
C-2W
•
•
•
PBGUNS Ion optics simulation
0.1 ms
10.0 ms
30.0 ms
60.0 ms
Ion beam
Neutral beam
Injected Neutral Beam
3-electrode configuration
200 3000 400
200 3000 200
400 400
2000
600 600
400 600
4-electrode configuration
• • • •
[Above] The beam (via power density) is injected into the wire for 30 ms.
Throughout the beam pulse, heat is transferred mostly in the x-direction.
[Right] The resistance increases during the beam pulse.
These models have helped us determine the size of the wires, and the applied current and voltage to use.
Design Results
•
• •
Neutralization (!neu) is regulated by puff valve pressure, and can be calculated by: " * #$#%&'(%)$
+#,
*
-$
= " /#)0
/*
%)$
0.80 0.76 0.72 0.68 0.64
This is an example of particle trajectories using a 4- electrode system. The voltages for a 3-electrode and 4- electrode system are shown.
Example of a tunable beam ramp compared to a static beam.
The switching of IOS from 3-electrode to 4-electrode system.
As the beam travels from the ion source to the main confinement vessel, there are two main loss mechanisms:
• Neutralization
• Beam duct transit
Injected beam power is estimated
from test stand measurements of beam size and a beam propagation model.3
A direct measurement of injected neutral beam power is needed to increase our understanding of injection efficiencies and source terms in power balance calculations.
0.25 0.20 0.15 0.10 0.05 0.00
where !dl is the duct loss coefficient, !cal is the calibration coefficient, and Pelectrical is the electrical power A scan of puff valve pressure reveals optimum neutralization settings.
Example [Right]:
Neutralization Tank
Bending Magnets
• • • •
Profile of eight tungsten wires Wire radius of 0.254 mm
Wire length of 0.3175 m
< 4% beam loss due to calorimeter
Wire Calorimeter
0 10 203040 506070 Time (ms)
0.5 mm wire diameter
0 10 20 30 40 Pressure (psi)
Neutralization losses ~20%
Beam duct losses ~10%
• • • •
•
• •
•
Individual diagnostics are installed at the end of each beam duct.
Each wire experiences a change in temperature (2T) due to beam power deposition (Pdep). A current is applied to each wire and the wire’s resistance (R ) is measured.
Resistance is used to find the temperature via the electrical resistivity-temperature relationship in Ref. 4.
Tunable Energy Beams
Evolution of 2D temperature inside wire
• •
During initial use of the diagnostic, a subset of beams were determined to
be misaligned 1000
800
The calorimeter measurements are superior to the SEEs measurements
in the dump for this analysis due to beam size at each location and 600 measurement resolution 400
Ion sources are on a gimble, capable of moving an ion source in four 200
1400
1200
1000
 800
 600
 400
 200
0 -0.4
Motivation
•
With the guidance of simulations, the wire calorimeter was designed with a:
• •
As pressure increases, an equilibrium pressure is reached.
Too much pressure leads to negative effects on the plasma generators.
Beam Duct
0.4 0.2 0.0
75 50 25
7.5 5.0 2.5 0.0
• •
• •
Pre-diagnostic, the time-dependent injected neutral beam power was estimated with electrical power, estimated duct losses, and optimum neutralization efficiency.
With the diagnostic measurement, a multiplication coefficient can be calculated from the ratio of measured power to average electrical power times average duct loss.
In addition, the captured neutral beam power is estimated by multiplying the injected neutral beam power by beam shinethrough.
[Left] An example of a high performance FRC plasma discharge on C-2W, characterized by magnetic estimates of excluded flux radius, average neutral beam shinethrough, and both the inject and captured neutral beam power.
A Wire Calorimeter for Direct Measurement of Neutral Beam Injection
C-2W Neutral Beams
2 TheC-2WneutralbeamsarebasedonC-2Uinjectors withmodificationstotheion
sources and power supplies for 30 ms pulses.
Four Static Energy Beams (15 keV)
• Up to 140 A (~2.1 MW electrical power per beam)
• Four arc-discharge plasma sources
• 3-electrode ion-optics system with multi-aperture slit optics for beam formation
Four Tunable Energy Beams (15 – 40 keV)
• Up to 140 A (~5.6 MW electrical power per beam)
• They switch between 3-electrode to 4-electrode system when high voltage is ramped
• 4-electrode system leads to smaller divergence
• Programmable voltage waveforms
• Tunable beams can be linked with active feedback control to balance pressure while ramping magnetic fields
• • •
Characterize the power deposition on each wire due to the neutral beam profile, Characterize the expected measured power from the diagnostic,
Determine if a calibration is needed.
bending magnet, so it is not adequate to calibrate in situ
Calibrations conducted on neutral beam test stand, where the 0.75 stand has: 0.70
• Identical beam line as C-2W
• Neutral beam parameters are well known 0.65
• No magnets or neutralization, minimizing measurement
uncertainty
The error bars on each point are from the uncertainty in the Gaussian fit of the measurements and the shot-to-shot variation (~5 shots each).
10 20 30 40 Measured Energy (kJ)
J.B. Titus, S. Korepanov, A. Tkachev, K. Pirogov, K. Knapp, and the TAE TEAM
TAE Technologies, Inc., 19631 Pauling, Foothill Ranch, CA 92610
Modeling of a Wire Calorimeter
Design and Study Requirements
The main design requirement of the diagnostic is to maximize the amount of signal level while minimizing the amount of surface intercepting the beam.
A model was developed to both narrow design features and develop an expectation of the diagnostic.
Specifically, the model should calculate the change in resistance of multiple wires due to a heat load from the neutral beam and then produce an expected measured power.
First, a study is performed on a single wire to:
• Characterize specific design features of the diagnostic (wire length, wire diameter, and possible thermal isolation of the wires),
• Understand how much heat conduction and thermionic radiation may affect the measurement. Second, a study is performed on a group of wires to:
Installation and Calibration
•
• •
• •
• •
•
•
Each calorimeter has a unique measuring efficiency
On C-2W, the beams lose current via neutralization and a
0.85 0.80
Length of wire
Temperature [K]
Temperature [K]
Temperature [K]
Temperature [K]
Temperature [K]
Temperature [K]
Temperature [K]
Temperature [K]
18-JAN-16 AT 15: 3:58 POSITIVE ION BEAM
S
TRAJECTORIES AND EQUIPOTENTIALS NEUTRAL
E-X
4.9V 15.0kV 40.5kV
40.1kV
0 2 4 6 8 10 12 14 16
Slit Length =0.0100 m , % Neutral = 99.0000 X
PLASMA I = 14.000000 A/m, TARGET I = 0.1052 A, Perv = 1.313E-08
• • •
[Left] The geometric beam propagation model is used to find the power density incident on each wire. [Right] Each power density is applied to a 2D heat transfer model (10 x 1000 points) at x=0.
Energy leaves the system via emissivity at x > 10
Before
0.0 Position(m)
After
-0.2 0.0 0.2 0.4 Position(m)
Known optimum efficiency
Optimum Regime
Geometric Model of Neutral Beam
Two-Dimensional Heat Transfer
Wires
Beam deposition
Temperature [K] 4000
Beam Dump
Wire calorimeters in beam line
Beam Analysis
Alignment
0 4000 0 4000 0
4000
3000
0 200
800 1000
10000 2 4 6 8 x-position (arb.)
2000 800 1000
10000 2 4 6 8 x-position (arb.)
2000 2000 •
The power deposited on each wire, Pdep, is calculate by: "-#3 = /4 Δ9,
0
5 10 15 20 25 30 Time (ms)
Power density of beam
  0
200
400
600
800
Model
Wire Calorimeter installed in C-2W
800 1000 800
10000 2 4 6 8 10000 2 4 6 8
1000
directions; Individual beam can be aligned within ~10 shots
-0.2
0.2
0.4
&567
where m is the mass, C is the specific heat, and :-#3 is the beam pulse time.
References
1H. Gota et al, Nucl. Fusion 59, 112009 (2019).
2P. Deichuli et al, Rev. Sci. Instrum. 86, 113509 (2015).
Acknowledgements
We thank our shareholders for their support and trust, and all fellow TAE staff for their dedication, excellent work, and extra efforts.
Eight measurements are made for a profile of Pdep.
The profile of Pdep is fit with a Gaussian and integrated to calculate an uncalibrated estimate of the inject power, Pmeas .
Gettering shielding
3 4
J. B. Titus et al, Rev. Sci. Instrum. 89, 101123 (2018). P. D. Desai et al, J. Phys.Chem. Ref. Data 13, 4 (1984).
Estimated injected power is: P = P injected meas
/ ;
cal
10000 2 4 6 8 x-position (arb.)
Thickness of wire
Resistance
4000 3000
Conduction
3000
2000
1000
Thermal emission
Evolution of total resistance in a wire
Time-Evolution of Neutral Beam Power
Power [MW]
Average
Shinethrough Flux Radius
[%] [m]
Excluded
Resistance [Ohm]
Neutralization Efficiency
0Y2
1.0000 mm/unit, 10.0 MAT. sq./unit
y-position (arb.)
y-position (arb.)
y-position (arb.)
y-position (arb.)
Signal (arb.)
Signal (arb.)
y-position (arb.)
Calibration (arb.)
| 1 |
