
Page 8 - Tomographic imaging system for measuring impurity line emission in a field-reversed configuration
P. 8
022506-8 D. C. Barnes and L. C. Steinhauer
Phys. Plasmas 21, 022506 (2014)
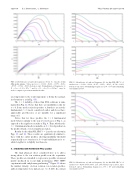
FIG. 12. Growth rates (a) and real frequencies (b) for ‘ 1⁄4 1 modes of thin SOL profile plasma. Curves are for a 1⁄4 0.119, 0.238, 0.357, 0.476, 0.595. 0.714, 0.833 (bottom to top). Normalization of frequencies to ð1 sÞx 1⁄42:38 105s 1 and k0 1⁄4ð1 sÞx =VA 1⁄40:95m 1 may be used to compare to previous normalized results.
ion temperature to the total temperature to define the normal- ized rotation a, as in Eq. (15).
The ‘ 1⁄4 1 stability of these thin SOL solutions is sum- marized in Fig. 12. Notice that there are instabilities only for a < 0. Some modes exist for positive a, but these are not the fundamental ‘ 1⁄4 1 mode considered earlier and do not have appreciable growth rates or are unstable for a significant range of k.
Notice that for these profiles, the ‘ 1⁄4 1 fundamental mode behaves similar to the non-reversed cases of Fig. 1, as opposed to the rigid rotor results of Fig. 8. Thus, whether the ‘ 1⁄4 1 fundamental mode is unstable at k 1⁄4 0 is dependent on the profile details, even for rigid ion rotation.
Results for the thin SOL FRC ‘ 1⁄4 2 modes are shown in Figs. 13 and 14. These results are qualitatively similar to those with the earlier profiles, showing instability threshold at practically zero rotation for k 1⁄4 0 and stabilization for re- alistic lengths for a slightly less than one.
V. SHEARED ION ROTATION FRC CASES
The final physical effect considered here is to add a strong shear to the ion rotation profile near the separatrix. These profiles are intended to represent a possible rotational profile produced in recent high performance FRC (HPF) experiments with end plasma gun biasing.18 Figure 15 shows the number density, electron rotation, ion rotation profiles, and ion temperature for a typical case (a 1⁄4 0.443). In contrast
FIG. 13. Growth rate (a) and real frequency (b) for thin SOL FRC ‘ 1⁄4 2 modes for a 1⁄4 0.119, 0.238, 0.357, 0.476, 0.595. 0.714, 0.833, bottom to top curves. Normalizing frequency is 2.38 105 and normalizing wavenumber is 0.95.
FIG. 14. Growth rate (a) and real frequency (b) for thin SOL FRC ‘ 1⁄4 2 modes for a 1⁄4 0.298, 0.595, 0.893, 1.19, 1.49, bottom to top a curves, top to bottom b curves. Normalizing frequency is 2.38 105 and normalizing wavenumber is 0.95.
