
Page 7 - Tomographic imaging system for measuring impurity line emission in a field-reversed configuration
P. 7
022506-7
D. C. Barnes and L. C. Steinhauer
Phys. Plasmas 21, 022506 (2014)
the equivalent rigid-rotor profile. The ion rotation is rigid for cases discussed in the present section.
The non-rigid electron rotation (Fig. 11(b)) makes the discussion in terms of a more complicated. We choose to define x in an average sense. Choosing the moment-of-iner- tia weighting, a physically reasonable result is obtained. The thin SOL profiles have a very peaked current density (and hence local x ) outside the separatrix, so we apply this aver- age only up to the separatrix radius. Thus, define
ðrs 3
2p drr nðXe XÞ
x 1⁄4 0 ðrs
2p drr3n
0
Using Jh 1⁄4 enrðXe XÞ 1⁄4 B0=l0 we can rewrite the nu-
2p drr nðXe XÞ1⁄4el drr dr 1⁄4el pBsrs / ; 0000
: (17)
merator of Eq. (17) as
ðrs 3 2pðrs 2dB 2 2
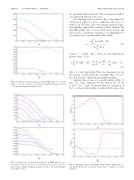
FIG. 9. Growth rate (a) and real frequency (b) in MKS units for ‘ 1⁄4 2 mode with a 1⁄4 0.2, 0.3 (bottom to top curves). Normalizing frequency is 1.02 105 and normalizing wavenumber is 0.46.
FIG. 10. Growth rate (a) and real frequency (b) in MKS units for ‘ 1⁄4 2 mode with a 1⁄4 0.4, 0.6, 0.8, 1.0, 1.2, 1.4 (bottom to top a curves, top to bot- tom b curves). Again normalizing frequency is 1.02 105 and normalizing wavenumber is 0.46.
(18)
where / is the trapped flux. While the denominator is just the moment of inertia. Thus, the averaging of Eq. (17) is ex- pressible in terms of physically meaningful quantities.
Applying this average to the profile shown in Fig. 11 gives the value indicated by the dotted line at Xe
5 1
1⁄4 4:47 10 s there. Consistent with the conventions of
Ref. 7, we have then used this x reduced by the ratio of the
FIG. 11. Thin SOL solution: (a) Number density profile; (b) Electron rota- tion profile. Dotted line is electron rotation used to estimate a for these solutions.
