
Page 3 - High sensitivity far infrared laser diagnostics for the C-2U advanced beam-driven field-reversed configuration plasmas
P. 3
11E128-3 Beall, Deng, and Gota
Rev. Sci. Instrum. 87, 11E128 (2016)
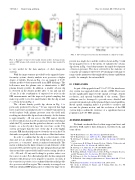
FIG. 4. Example of time-resolved radial density profile, showing sustain- ment of FRC plasma with central and secondary density dips (marked by arrows).
is very useful for the data analysis of other diagnostic systems.
With the improvements provided by the upgraded inter- ferometry system, density analysis now possesses a higher degree of fidelity. Shown in Fig. 4 is an example of C-2U density profile evolution measured in an HPF discharge. The hollowness near the plasma axis is characteristic to FRC plasma density profiles. In addition, a smaller o↵-axis dip is observed in the density profile after ⇠1 ms and can last >5 ms. It is the combination of superior low noise in the FIR measurements and the improved spatial sampling that make it possible to resolve small features like the dip around r =25cmshowninFig.4.
The o↵-axis density profile dip shown in Fig. 4 is previously predicted by theory.11 It was expected that high fast-ion pressure accumulation due to neutral-beam injection would replace bulk plasma pressure near the field null, resulting in a detectable dip in electron density. As the feature is approximately ⇠10 cm across, the FIR cannot directly resolve it with its chords at 15 cm intervals. On the other hand, while the CO2 system has the spatial resolution to resolve this feature, on a shot-by-shot basis the error bars on the CO2 system are larger than the size of the dip. It is the highly accurate FIR data that help narrow down the errors in the CO2 data and consequently lead to the resolution of this fine feature.
In order to confirm that the dip is a true feature of the data and not an artifact of the interpolation and inversion processes, a “concavity” metric is analyzed statistically. The metric is defined as the finite-element second derivative of the measured CO2 interferometer raw line integral density profile data around the expected field null location (using chords at 15, 20, and 25 cm) and looking for positive values over the course of a shot. For a flat radial profile, the line-integrated densities will always possess negative concavity. As such, if the concavity is positive, it is confirmed that the radial profile also possesses a hollow region. The concavity is averaged over 546 near-identical HPF plasma shots to reduce the large errors
FIG. 5. Shot-averaged concavity near the field null as a function of time.
present in a single shot, and the result is shown in Fig. 5 with the propagated errors of the metric. It validates the o↵-axis dip shown in Fig. 4 and demonstrates the rapid development of fast-ion pressure. The shots selected for the statistics of concavity are similar to the best C-2U discharges with narrow ranges in the parameters that might a↵ect plasma equilibrium profile, for example, the external field.
IV. CONCLUSION
As part of the upgrade from C-2 to C-2U, the interferom- etry system was upgraded with 4 chords of FIR. These new chords significantly improved the spatial coverage, density resolution, and spectral bandwidth of the system. These additions can be leveraged to provide more detailed and accurate information about the plasma behavior and equilibria. Broad spatial sampling makes it possible to monitor and account for plasma motion, and the resolution of the FIR system helps confirm the existence of a significant fast-ion population in C-2U FRC plasmas.
ACKNOWLEDGMENTS
We thank our shareholders for their support and trust, and all fellow TAE sta↵ for their dedication, excellent work, and extra e↵orts.
1M. W. Binderbauer et al., Phys. Plasmas 22, 056110 (2015).
2M. W. Binderbauer et al., AIP Conf. Proc. 1721, 030003 (2016).
3B. H. Deng, J. S. Kinley, and J. Schroeder, Rev. Sci. Instrum. 83, 10E339 4(2012).
O. Gornostaeva, B. H. Deng, E. Garate, H. Gota, J. Kinley, J. Schroeder, and
M. Tuszewski, Rev. Sci. Instrum. 81, 10D516 (2010).
5B. H. Deng et al., Bull. Am. Soc. 55, GP9.00100 (2010).
6H. Y. Guo et al., Phys. Plasmas 18, 056110 (2011).
7B. H. Deng, M. Beall, J. Schroeder, G. Settles, P. Feng, J. S. Kinley, H. Gota,
and M. Thompson, Rev. Sci. Instrum. 87, 11E125 (2016).
8B. H. Deng et al., Rev. Sci. Instrum. 85, 11D401 (2014).
9C. H. Reinsch, “Smoothing by spline functions,” Numer. Math. 10, 177–183
10(1967).
11H. K. Park, Plasma Phys. Controlled Fusion 31, 2035 (1989).
M. Onofri, S. Dettrick, D. Barnes, and T. Tajima, Bull. Am. Soc. 60, BP12.00032 (2015).
