
Page 3 - Dual wavelength imaging of a scrape-off layer in an advanced beam-driven field-reversed configuration
P. 3
11E520-3 Bolte et al.
Rev. Sci. Instrum. 87, 11E520 (2016)
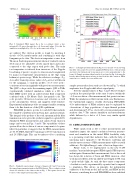
FIG. 5. Simulated FIDA signal. X0 is the x-coordinate where a line- integrated LOS passes through the y=0 (horizontal) plane. Note that the simulation is multiplied by 4.5 to be on the same scale as Fig. 3.
are utilized. The electron profile is found by inverting 6 chords of CO2 interferometry and combining it with edge Langmuir probe data. The electron temperature comes from Thomson Scattering measurements taken at 9 radial locations (0-41 cm) at two adjustable closely spaced times and is also connected to the edge region with probe data. The main ion temperature is inferred from inversions of the Doppler broadening of passive oxygen 4+ emission and is augmented by main ion temperature measurements in the edge using helium jet spectroscopy. While the e↵ective ion charge, Ze↵, does a↵ect beam deposition, values of Ze↵ are not well known for the campaign, so uniform profiles of 1.5 were used— consistent at least in magnitude with previous measurements. The Q2D9 code provides the remaining inputs. Q2D is TAEs experimentally validated simulation, which is a 2D two- fluid MHD model with an added neutral fluid component combined with a 3D Monte Carlo fast-particle code. The code provides 3D fast-ion locations and velocities as well as the axisymmetric electric and magnetic field structure. Experimental midplane profiles are mapped axially assuming them to be flux functions of the Q2D equilibrium.
FIDASIM produces spectra for each LOS that includes the separable contributions from beam, halo, and fast neutrals. The integral of the product of the total spectrum and the filter transmission curve gives the synthetic signal for a given LOS. Simulated FIDA measurements and camera beam emission image can be seen in Figs. 5 and 6. The separability of these spectra allows the isolation of various components to be quan- tified. In particular, it suggests that the FIDA measurements are 99.8% FIDA while the beam image is 98% beam emission and 2% FIDA light. This can be understood by considering
FIG.6. Simulatedcameraimage.Averageofimagesat0.5and1.5msusing the same plasma parameter inputs as the FIDA dataset. The coordinate system shown for reference is the same as that in Fig. 1. The square denotes the location of the sample spectrum in Fig. 7(b).
FIG.7. (a)SamplespectrumtakenfromFig.5at1.5msand 17cmshowing that filter only accepts broad, lower-amplitude FIDA portion of the spectrum and rejects the thermal and beam emission for views perpendicular to the beam. (b) Sample spectrum taken from the boxed pixel in Fig. 6 showing the heavily shifted beam emission being isolated from the halo emission. FIDA emission is too small to be seen on this scale.
sample spectra taken from each case (shown in Fig. 7), which emphasize how Doppler shift a↵ects signal purity.
Note the similar features of Figs. 3 and 5. They both have a peak in the spatial profile at the same location (within the ⇠4.5 cm resolution of the measurement) that persists in time. While the simulation is flatter in time with some fluctuations, the experimental signal is steadily decreasing. FIDASIM’s 4.5⇥ underestimate of FIDA radiation may be explained by observations of large populations of super-thermal protium and deuterium in C-2U as observed by recent neutral particle analyzer data.10 The camera simulation and measurement, while di↵erent by a factor of 5, have very similar spatial dependencies.
IV. CONCLUSIONS/OUTLOOK
While much work is left to refine measurements and simulation inputs, the spatial correlation between measure- ment and simulation in this initial FIDA feasibility study is a promising result that indicates that—with the help of upcoming major upgrades to the Thomson scattering and interferometer systems—FIDA measurements will be a useful addition to Tri Alpha Energy’s suite of fast-ion diagnostics.
Future work, to be implemented on the new C-2W machine,2 may include integrated FIDA signals, FIDA spectra, and integrated beam and halo measurements. Just as this work has shown the isolation of beam and FIDA emission, other work has used filters at the un-shifted wavelength of 656.1 nm to pick-out halo light. As such, the three major components of radiation can be experimentally separated and compared to simulation. This allows, in principle, the independent validation of the beam model, halo model, and FIDA model. However, considering how well FIDASIM has been validated
