
Page 7 - Drift-wave stability in the field-reversed configuration
P. 7
092518-7
Onofri et al.
Phys. Plasmas 24, 092518 (2017)
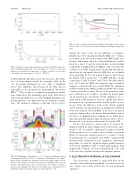
FIG. 9. Evolution of the density gradient scale length of the FRC at the sepa- ratrix. (a) Density length scale at the separatrix at z 1⁄4 0 and t 1⁄4 0.5 ms as a function of the initial ion temperature. (b) Time evolution of the density scale length at the separatrix at z 1⁄4 0 for Ti 1⁄4 1000 eV.
feedback that the fluctuation level also decreases. The turbu- lence develops mainly outside the separatrix, while in the core, the density fluctuations are two orders of magnitude lower.4 The turbulence that develops in the SOL may be responsible for the anomalous electron transport observed in FRCs.2–4 These results are confirmed by gyrokinetic simula- tions, which show that instabilities grow in the SOL when a critical density gradient is exceeded.4 In Q2D simulations, the density gradient is not limited by the development of turbu- lence, but anomalous transport coefficients can be used to
FIG. 10. Equilibrium configuration of C-2: (a) Initial equilibrium density and magnetic field lines for the C-2 simulation. In addition to the confine- ment vessel, it includes the formation sections, the mirror plugs, and the divertors. The magnets are shown in brown, the insulating walls in green, and the conducting walls in gray. (b) Illustration of the fluxes of particles that cross the separatrix (C), particles lost radially (CSOL), and particles lost through the mirrors (CM). These fluxes are discussed in Sec. VI.
FIG. 11. Time evolution of the density gradient scale length Ln in the experi- ment for shot 36 691 (black line) and in a simulation with mirror plugs (red line).
emulate the effect of the electron turbulence on transport. Simulations of C-2 experiments with the Q1D code11 obtain a good match of the observed evolution of the FRC radius, tem- perature, and density when the classical diffusivity is multi- plied by a factor 5, and the perpendicular electron thermal conductivity is multiplied by 20. Q1D is a 1D code where the evolution of the FRC length and the beam shine-through are taken from the experiment, while in Q2D, they are calculated self-consistently. In C-2, six neutral beams are injected into the plasma with a total power of 4.2MW and three energy components of 20 keV, 10 keV, and 7.5 keV. We did a simula- tion of C-2 with the Q2D code using the same anomalous transport coefficients that were used in Q1D. The simulation includes neutral beams and the neutral gas produced by charge exchange and wall recycling. The use of the anomalous trans- port coefficients is not enough to reproduce the density gradi- ent measured in the experiments. In this simulation, we see again that the SOL plasma is lost more rapidly than what is measured in the experiment and the density profile becomes steeper. Thus, the difference between the density gradient observed in the experiment and in our simulation is attributed to the lack of kinetic effects in Q2D: (i) the lack of anomalous transverse transport due to the kinetic drift instabilities and (ii) the lack of longitudinal mirror trapping effects, which main- tains faster parallel transport than experiments. In Sec. VI, we discuss some of the mirror confinement effects in the SOL.
On the other hand, we observe that if we increase the magnetic field in the mirror plugs from 2 T (used in the exper- iment) to 4T, the parallel confinement is improved and the density profile is closer to what is observed in the experiment. Figure 12 shows the density profile at z1⁄40 and t1⁄40.6ms measured in the C-2 experiment (shot 36691) compared with density profiles obtained from two simulations, with mirror plug fields of 2 and 4 T. Again the higher parallel transport observed in simulations with a weaker plug magnetic field might be due to kinetic effects not included in the code, such as the reflection of particles between the magnetic mirrors.
V. ELECTROSTATIC POTENTIAL IN THE DIVERTOR
The electrostatic potential / along field lines in the expander is determined by longitudinal electron pressure bal- ance, which can be derived from the electron momentum equation41
