
2018_HTPD_Titus_SEEs_v3
P. 1
Parameter
Number of 15keV non- switchable injectors
Number of 15-40keV switchable injectors
Beam energy, keV
Ion current per source, A
Pulse duration, ms
Power in neutrals through the port, per beamline, MW
Total NB power, MW
6 8 0 0
15 15 130 140 8 30
1.7 ~1.7 ~10 ~13
4 4
15/40
140
30
1.7 @15keV
3.5 @ 40kV ~21
n
n
n
n As the instability grows, the plasma wobbles in and out of the view of oppositely injected beams
Secondary Electron Emission Detectors for Neutral Beam Characterization on C-2W J.B. Titus, R. Magee, I. Isakov, K. Pirogov, S. Korepanov and the TAE TEAM
Abstract
Heating, current drive, and partial fueling from neutral beam injection are essential to sustainment of C-2W field- reversed configuration (FRC) plasmas. C-2W has eight 2.1 MW neutral beams (total of 16.8 MW), capable of providing an elliptically-shaped beam of 15 keV hydrogen neutrals for 30 ms. To maximize the effectiveness of neutral beam injection, duct losses must be minimized. Maintaining beam alignment and optimizing beam current for minimum divergence achieve this. Each beam terminates on a vertical and horizontal array of secondary electron emission (SEE) detectors (nine in the vertical, seven in the horizontal, sharing one in the middle). The molybdenum detectors are spatially separated to characterize the beam size and alignment. With knowledge of the geometry of the vacuum ducts and horizontal and vertical beam profiles from test stand measurements, the focal length, divergence and power loss were calculated. Through characterization, the set of neutral beams are optimized to inject up to ~12 MW of power into the confinement vessel throughout the plasma discharge.
TAE Technologies, Inc., 19631 Pauling, Foothill Ranch, CA 92610
Test Stand Beam Characterization
n A similar array of SEE detectors was used to characterize the horizontal and vertical beam profile for each neutral beam on a test stand
n Estimates of the horizontal beam divergence αx, vertical beam divergence αy and focal length R was calculated for each beam.
n Assuming the beamlets from the ion source grid are Gaussian and are homogeneous over the entire area (radius a = 17.0cm), the ion current density at each x, y, and z coordinate away from the grid can be calculated from:4,5,6
where J0 is the total current, αx,y are the horizontal and vertical divergences, x0 and y0 are the horizontal and vertical points from the ion source grid,
and
Plasma Characterization
Machine Overview
n C-2W experiment:1 an advanced, beam driven field-reversed configuration (FRC)2 plasma
n Eight 15keV neutral beams and edge biasing
n Results from C-2U experiment: neutral beam pulse duration was
correlated to plasma lifetime and critical for sustainment3
n Managing beam power losses is crucial for plasma performance n The main sources of beam power losses:
n largedivergencesfromunoptimizedbeamcurrents n beammisalignment
Ion Emitter
Neutral Beams
C-2U C-2W phase 1 C-2W phase 2
n n
The C-2W neutral beams: based on n C-2U injectors with modifications to
the ion source and power supplies for
30 ms pulses n
n 30% more power. n
n Four arc-discharge plasma sources
n 3-electrode ion-optical system with multi-aperture slit optics for beam formation.
Due to the elliptical shapethe beam can scrape the vacuum ducts along the major axis on the way to the confinement vessel (CV)
The total current distribution for a given z is calculated with j(x, y, z)
With a matrix of beam parameters at each z, a least squares fit of model to experimental beam size estimates the beam divergences and focal
length
Using the estimated parameters, the ion current density was modeled at each vacuum duct to determine power loss to scraping
n Asmall,butrelevantportionofbeaminthehorizontaldirectionisclipped,leadingtosomepowerloss Calculations show that <10% of beam power power due to scraping the vacuum ducts
The test stand measurements were used to create a database of power loss dependence on beam current for C-2W beam power measurements
Beam Characterization and Optimization
n n
Excluded flux radius (from magnetic probe @ 239o) estimates the plasma radius and lifetime and the n = 1 instability which contributes to the degradation of plasma confinement
Measurements from the central SEE detectors of two, oppositely injected beam are shown
n Plasma absorbs most of the beam when the shine through is low, where: shine through = signal during plasma/vacuum signal
The formation of the FRC in the CV happens ~50 μs, and the plasma is sustained by up to 10 MW of absorbed neutral beam power and edge biasing until around 1.5 ms
Secondary Electron Emission Detectors
n deformations in the FRC increase and the plasma radius shrinks
n The plasma wobbles in an unsymmetrical way, creating a scenario of asymmetric beam injection and
absorption
Summary
n Eight 15keV neutral beams have been installed and sustain C-2W plasmas
n SEE detectors were used on a test stand to calculate the divergences and focal length of each beam and to estimate
the power loss due to scrapping of the beam ducts
n SEE detector arrays have been installed and implemented in each of the beam dumps
n characterize beam alignment, plasma instabilities, and beam power input into the plasma
n Beams are currently being aligned and oprerated at optimized beam currents for minimum power loss
Collimator
n Collimator: diameter of 1.0 mm; length of 9.0 mm
n Beam neutrals interact with a molybdenum target, producing a
current of secondary electrons, which is proportional to neutral-beam particle flux
n Currentisconvertedintoavoltagesignal:100Ohmresistor (0.1%, 25 ppm/oC); amplified by a factor of 7 by amplifier IC in a differential configuration
n Signal is processed through a 10 MS/s data acquisition system and passed through a common mode filter for noise reduction
n This noise is limited between 1-2% of the signal level; Fluctuations from plasma density changes and beam variation are between 6-7% of the signal level
8 9
8 9
Measurements of the horizontal and vertical profiles before a plasma discharge. Error bars are a measurement of beam variation., but due not take into account misalignment of detectors
A Gaussian fit was made of both profiles and used to reconstruct a two-dimension Gaussian fit
n Power absorbed by the plasma is estimated around 60% References
1M. W. Binderbauer et al. Recent Breakthroughs on C-2U: Normans Legacy. AIP Conference Proceedings, 1721(1):030003, 2016.
2M. Tuszewski. Nucl. Fusion, 28(11):2033, 1988.
3H. Gota et al. Nucl. Fusion, 57(11):116021, 2017.
Mo Target
11
22
33
41514 13 412 11 10
1011125613 141556 77
Beam Dump
n Two beams converge onto one beam dump
n Each beam is centered on an array of SEE detectors
n Nine detectors in the vertical direction and seven detectors in the horizontal direction, crossing at detector 5
n Detectors 5 and 15, 13 and 14 share the same aperture
n Alignment: beam profiles were made to determine misalignments and corrections
n The two-dimensional profiles are integrated over to estimate beam power input into the plasma
4 5
Acknowledgements
We thank our shareholders for their support and trust, and all fellow TAE staff for their dedication, excellent work, and extra efforts.
a
y0
Observation Plane
wherei isxandy. Focus z
y
x0 xR
A. A. Ivanov et al. Rev. of Sci. Instrum., 71(10):3728{3735, 2000.
T. D. Akhmetov, V. I. Davydenko, and A. A. Ivanov. IEEE Trans. on Plasma Sci., 36(4):1545{1551, Aug 2008. 6Neutral Beam Characterization. Technical report, TAE Technologies, Inc., Nov. 2017.
7M. Osakabe et al. Rev. Sci. Instrum., 72(1):590{593, 2001.
8M. Tuszewski. Physics of Fluids, 24(11):2126{2127, 1981.
n = 1
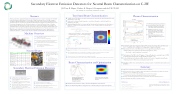
A C-2W discharge during biasing experiments
n [Top] Excluded flux radius in the plasma frame (blue) and radius measured at ! = 239o (orange) during a plasma discharge
n [Middle] Central detectors of neutral beam 2 (blue) and 5 (orange) during a plasma discharge. Due to the beams injecting at nearly 180o apart; wobble is out of phase
n [Bottom] Total electrical power (blue), total electrical power minus losses (orange), and total power into the plasma (green)
| 1 |
