
BolteHTPD2018
P. 1
Abstract
TAE’s advanced, beam-driven field-reversed configuration device has a large fast-ion population, allowing for fast-ion D-alpha (FIDA) studies. Development of a FIDA spectrometer for the new C-2W device is underway. Previous measurements [1] were combined with C-2W geometry to inform the design. Measured signal levels led to the purchase of a Phantom Miro 110 high-speed camera that will be paired with a Holospec f/1.8 spectrograph from Kaiser Optical Systems, Inc. The spectrograph utilizes a custom transmission grating centered at 656.0 nm. Simulations were used to choose available ports with large predicted signals. Eight neutral beams and 354 ports were considered. Experimentally-obtained 1D plasma profiles from C-2U were mapped onto Q2D [2] simulation flux surfaces. For each point on the vessel wall, many lines-of-sight (LOS) are created to view the entirety of each neutral beam path. FIDA spectra are simulated for each line-of-sight using FIDASIM [3]. Integrating over wavelength and beam-space allows individual ports to be chosen for their large prospective signals.
Spectrometer Design n Restrictions / Needs:
n Low light levels
n Fixed ~13 nm spectral width, centered on 656 nm n 1 ms beam-on integration time
n Solutions:
n Holospec spectrograph – Kaiser Optical Systems, Inc. High throughput f/1.8 lenses
Transmission grating & prism (“grism”) (T = 70-90%)
n Phantom Miro 110 camera
High-speed, 1600 fps at 1280x800 pixel
Low-noise, negligible dark current, 29 e- readout noise
n Signal-to-Noise Ratio (predicted) n C-2U FIDA levels:
Beam-off: 3.1 1017 ph/(s-nm-m2-sr)
Beam-on: 4.1 1017 ph/(s-nm-m2-sr) n SNR (1 ms integration)
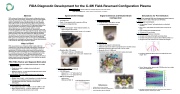
Signal Collection and Neutral Beam Configuration
n Machine-Side Optics
n Large diameter (1 mm) fibers, 0.22 NA
n 1” machine-side collimating lenses
Simulations for Port Selection
n Goal: Find expected FIDA level viewing any beam from any location. Use to select final port (of 354 total).
n Method (per neutral beam):
n 182 simulated “lenses” uniformly placed on cylindrical
chamber
n Each ”lens” views beam with uniform grid of 195 lines-of- sight
n Total of 35490 lines-of-sight per beam
n ~2 hours on 12-core cluster
n Post-Processing (dimension reduction):
n Consider only blue-shifted light (avoid impurities)
n Consider only portions of spectra where FIDA/non-FIDA >= 2 n Integrate each LOS spectrum over useable wavelengths
n Produces integrated FIDA emission for single beam, from single “lens”
n Sum of beam contour gives scalar FIDA-like value for a single lens and a single beam
What is FIDA?
fast ion orbit
cx with neutral radiation
n Neutral Beams
n Tilted 26o with respect to horizontal (y)
n Tilted 22o toward core relative to perpendicular to machine axis (z) n Modulated at 500 Hz at 50% duty cycle (1 ms int. times)
n Nominally 15 keV, 1.5 MW each
n Switchable beams (can rise to 40 keV) to replace two beams
FIDA measurements are of Doppler-shifted D-alpha light from neutrals born of the charge exchange (CX) between confined fast- ions and neutral beam or halo neutrals. The radiation occurs so quickly after CX that the location and velocity of the neutral are effectively that of the confined fast ion. Viewing geometry and fast- ion velocities produce broad FIDA spectra detectable beyond the range of thermal emission. While a full beam deposition and collisional-radiative model (FIDASIM) is used to interpret the data, a simple control-room level interpretation is also afforded as signals are proportional to fast-ion densities.
FRC FIDA History and Upgrade Motivation
n Previous work: First ever FIDA measurements on an FRC made on C-2U [1]
n Single line-of-sight – multiple shots to build radial dependence
n Bandpass filtered – no velocity/wavelength information (other than min. head-on of 3 keV)
n Current work: First ever FIDA spectra on an FRC to be made on C-2W
n Multiple lines-of-sight – radial dependence in single discharge n Full blue- and red-shifted spectrum to be measured –
velocity/energy resolution. Possible velocity-space tomography
n Fast-ion changes: C-2U to C-2W
n 30% higher beam power – 10 MW in C-2U to 13 MW in C-2W
n Higher injection energy – 15 keV in all beams in C-2U to 15 keV in half of beams and 40 keV in half in C-2W
x
FIDA Diagnostic Development for the C-2W Field-Reversed Configuration Plasma
Beam-off: 56 Difference (FIDA): 12
C-2U FIDA Measurements
z
Nathan G. Bolte, Marcel Nations, Deepak Gupta, and Juan Aviles
TAE Technologies, Inc., 19631 Pauling, Foothill Ranch, CA 92610
References
N. Bolte, Rev. Sci. Instr. 87 (2016).
M. Onofri, Phys. of Plasmas 24, 092518 (2017).
1.
2.
3. http://d3denergetic.github.io/FIDASIM/.
n Red beam centerline projected onto wall, enters at O, exits at X. Diamonds are ports. Chosen port circled.
| 1 |
