
An Ion Beam System for Absolute Calibration of Neutral Particle Detectors for C-2W
P. 1
Relaxation
Instability
excluded flux (event avg.)
0.2 0.4
neutrons (event avg.) 6
5
0
10 20 30 40 50
Drive
Free energy
6
5
4
3
2
1 0
40 30 20 10
0
-0.4
-0.2
0.0
t rel. (ms)
0.2
0.4
• •
•
•
• •
•
Passivated Implanted Planar Silicon (PIPS) detector from Canberra Industries, Inc.
Active area = 5000 mm2
Si thickness = 300 μm, entrance window < 50 nm
•
•
Time histories of neutron and proton detector signals similar during neutral beam modulation.
Signal drop due to magnetic reconnection steeper in proton signal, indicating larger drop in core relative to edge -> profile flattening.
During magnetic reconnection event, emission at edge (black and red curves) increases while emission in core drops (purple and blue curves).
Emission profile flatten1s50at the reconnection event and recovers shortly after.
150 100
50
• In the RFP, tearing modes driven by ∇J cause 3
R"="1"Ω" "C"="1"nF"
50 40
30 20 10
0.27
0.22
0.01
0.01
0.02
0.02
0.03 Time (s)
0.03 Time (s)
0.04
0.04
Steerable collimator allows line-of-sight to be changed continuously and without breaking vacuum.
Collimation provided by interchangable collimation heads (2° or 13°)
10 μm Pt foil provides superior soft x- ray shielding while similarly passing fusion protons, compared to 40 μm Al.
-2 -1 0 1 2 t (ms)
-1
0
t (ms)
1
2
bursts of magnetic reconnection which both
10
accelerate and re-distribute NB injected fast ions.
-3 -2 -1 0 1 2 3 Time relative to sawtooth (ms)
0.11
0.05 8
6 0.00 4 2
0 0.00
Orbit tracing
Summary
1
100
50
0 -2
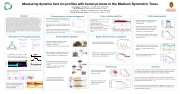
Measuring dynamic fast ion profiles with fusion protons in the Madison Symmetric Torus
Abstract
NeutralbeaminjectedfastionsplayadominantroleinboththeTAEfield-reversed configuration (FRC) and the Madison Symmetric Torus (MST) reversed field pinch (RFP), making fast ion diagnosis a major pillar of both research programs. And as strongly self-organized plasmas, the FRC and RFP similarly exhibit dynamic relaxation events which can redistribute fast ions. Recently, a collaboration between TAE Technologies and the University of Wisconsin was conducted to develop a method for measuring a fast changing fast ion spatial profile with a fusion protondetectorandtoinvestigatecommonalitiesbetweenthetwoplasmas.Thesteerable detector was designed and built at TAE and installed on MST. The fusion proton emission profile resulting from injection of a 25 kV deuterium neutral beam is measured with 5 cm spatial resolution and 100 s temporal resolution over the course of several 10s of shots. The fast ion density profile, inferred by tracing orbits of fusion protons through a reconstruction of the plasma magnetic field, is observed to flatten during global magnetic tearing mode activity, dropping by 30% in the core and increasing by a similar amount at the edge. The profile is observed to remain stiff during energetic particle mode (EPM) activity, consistent with measurements made with a collimated neutron detector.
Fusion products for fast ion diagnosis
Pulse counting algorithm
Noassumptionsaboutfunctionalformofpulse shape are made.
“Ideal pulse” created from average of many measured pulses (10000+). Likewisefordoublehits(~500).
Single (red) and double (blue) pulses found in signal trace via peak detection.
Pulses compared to ideal pulse, if RMS of difference is below critical value, pulse is counted.
Profile measurements
10
excluded flux (event avg.)
40
30
Measurement is sensitive to small changes in
Relaxation in self-organized plasmas
Proton detector hardware
Single channel neutron comparison
fi 20 20
20
10
0
-0.4 -0.2 0.0 0.2 0.4
on emission profile.
0 0
0
microbursts in the FRC
reconnection in the RFP
beam blips (single shot)
protons
neutrons
-0.4 -0.2 0.0
t rel. (ms)
Major components: (1) PIPS detector, (2) 40 μm
Al or 10 μm Pt foil, (3) collimator, (4) vacuum
housing, (5) gate valve, (6) isolated feed thru 3"
t rel.
(
ms)
neutrons (event avg.)
800 600
400
200
40
30 2 20
1170613118
0.05
1170613091
0.05
1.2 1.0 0.8 0.6 0.4 0.2 0.0
0.06
1.2 1.0 0.8 0.6 0.4 0.2
0.06
1"
150 100
50
4
00
-0.4 -0.2 0.0 0.2 0.4 5
t rel. (ms)
4
3
2
1
0 0.00
30 25
• In the FRC, fast ion pressure drives n=2 micro-bursts which both accelerate and re- distribute NB injected fast ions.
• Even through ρL>>a, accurately accounting for magnetic field deflection is critical.
• Measurement sensitive to small changes in profile width and Shafranov shift.
0.6 0.4
0.2
-0.0
-0.2
-0.4 -0.6
1.2 1.0
0.8
0.6
0.4
0.2 0.0
1.2 1.0
0.8
0.6
0.4
0.2 0.0
-5
orbit tracing
0 5
detector angle (deg.)
σ = 5 cm σ = 10 cm σ = 15 cm
• A collaboration between TAE Technologies and the University of Wisconsin – Madison has resulted in the development of a fusion proton diagnostic capable of measuring proton emission profiles with 5 cm spatial and 100 μs temporal resolution.
• The fast ion density profile can be inferred from the measurement by tracing proton orbits in the reconstructed magnetic field. The measurement is sensitive to changes in profile widths and Shafranov shifts of ~ 1 cm.
• A successful measurement has been made during a magnetic reconnection event on MST. A similar measurement will be made on the C-2W FRC to investigate fast ion redistribution during a microburst.
27
26
25
24 23
6.0 6.2
straight-line approx.
Both phenomena require a diagnostic capable of measuring fast changes to the fast ion spatial distribution to further understanding
5 μm Al / 10 μm Pt
NB on time
6.4 6.6 t (ms)
6.8
Magnetics (n=2)
7.0
40 μm Al
300 200
100 0
20 15
10
5 0
15 10 5
NB on time
0.16 20
15 10 5 0
• Beam-plasmafusiondominatesthermonuclearfusion when ~10 kV, 10-100 A deuterium neutral beam injected into ~500 eV deuterium plasma.
• Signalisproportionaltoconfinedfastiondensity,rather than lost like charge exchange neutral diagnostics (NPA, FIDA, etc).
Beam energy (keV)
10 12 14 16 18 20
• •
• •
•
•
Neutron detectors capable of high time resolution, but difficult to collimate. Proton detectors easily collimated, but limited time resolution due to pulse counting.
H0
D0 .
0
-200 -100 0
t (us)
100 200
-5 0 5 10 15 detector angle (deg.)
R. M. Magee, S. Korepanov, L. Frausto, and the TAE Team
TAE Technologies, Inc., 19631 Pauling, Foothill Ranch, CA 92610
J. K. Anderson, J. Boguski, P. J. Bonofiglo, J. Kim, and R. McConnell
University of Wisconsin – Madison, 1150 University Ave., Madison, WI 53706
4"
105
•
•
•
•
•
Equilibrium profile measurements made with 120 steerable collimator in sawteeth-free, non- 100
120 100
80 60 40 20
0 -5
energy (keV)
energy (keV)
f (kHz)
expected signal (a.u.)
Z (m)
r∆φ (cm)
expected signal (a.u.)
n flux (arb)
bθ n=5 (G)
n flux (arb)
bθ n=5 (G)
H Energy (keV)
Beam Power (MW)
Beam Power (MW)
count rate (kcps)
signal
count rate (kcps)
count rate (kcps)
count rate (kcps)
count rate (kcps)
count rate (kcps)
signal (V)
r (cm)
signal (V)
r (cm)
count rate (kcps)
count rate (kcps)
count rate (kcps)
reaction rate (cm-3s-1)
10
4
103
102
101
100 0.0
80 reversed plasma. 60
0.2
0.4
T (keV)
0.8
1.0
Average measured emission profile (colored 0
D + D è T (1 MeV) + p (3 MeV)
è He3 (0.8 MeV) + n (2.5 MeV)
120 120
6"
00
-2 -1 0 1 2 -5 t (ms)
150 100
50 before during
after
0
-5 0 5 10 15 20 25 r (cm)
x-ray saturation
2"
0.6
20
30
t (ms)
40
50
60
15
PIPS"detector"
Variable"bias"
5"
40"μm"Al"foil" Cu"RF"shielding"
2"MHz,"106"ICV"amplifier"
60"MS/s"12Cbit"ADC"
t (ms)
proton pulses
x-ray pulses
1.0 1.2 1.4 1.6 1.8 2.0 R (m)
shift = 5 cm shift = 0 cm
10
15
0
neutrons (scaled)
protons
40 20
diamonds) agrees well with emission profile 0
expected from Gaussian fast ion density
profile with σ = 9 cm (solid black line).
n (r); dashed-dotted line indicate ±2 cm effect
100 100
80 80
60 60
40 40
10 20 30 40 50 60 t (ms)
-5 0
detector angle (deg.)
150 100 50
5
10
| 1 |
