
HTPD18_Poster_TMatsumoto
P. 1
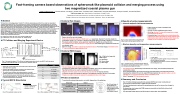
 Fast-framing camera based observations of spheromak-like plasmoid collision and merging process using two magnetized coaxial plasma gun
Tadafumi Matsumoto1,2, Thomas Roche1, Ian Allfrey1, Hiroshi Gota1, Tomohiko Asai3, Takahiro Edo3, Akiyoshi Hosozawa3, Fumiyuki Tanaka3, and the TAE Team
nAbstract
We have been conducting compact toroid (CT) collision and merging experiments by using two magnetized
coaxial plasma guns (MCPG). As is well known, an actual CT/plasmoid moves macroscopically in a confining magnetic field. Therefore, three-dimensional measurements are important in understanding the behavior of the CTs. To observe the macroscopic process, we adopted a fast-framing camera (ULTRA Cam HS-106E) developed by NAC Image Technology. The characteristics of this camera are as follows; a CCD color sensor, capable of capturing 120 images during one sequence with a frame rate of up to 1.25 MHz. Using this camera, we captured the global motion of a CT inside the magnetic field and the collision of two CTs at the mid-plane of experimental device. Additionally, by using a color sensor, we captured the global change in plasma emission of visible light during the CT collision/merging process. As a result of these measurements, we determined the CT’s global motion and the changes in the CT’s shape and visible emission. The detailed system setup and experimental results are presented and discussed.
1TAE Technologies, Inc., 19631 Pauling, Foothill Ranch, CA 92610, USA 2Department of Physics and Astronomy, University of California, Irvine, CA 92697, USA 3College of Science and Technology, Nihon University, Chiyoda-ku, Tokyo 101-8308, Japan
nCamera Raw images
nResults of probe measurements ØInternal magnetic field measurements
[1] I. Allfrey et al., Bull. Am. Phys. Soc. 62, BP11.00054 (2017). [2] T. Matsumoto et al., Rev. Sci. Instrum. 87, 11D406 (2016).
nCT Collision and Merging Experiment Device Transverse field coil
• Figures show the raw color images.
• Frame rate and shutter speed are 500 kHz and 1 μs, respectively. Typical CT velocities inside the
confinement vessel is 70 – 100 km/s. Therefore, the shutter speed is enough to get the CT’s structure.
• The plasma emits the Balmer series spectrum: D" (656 nm), D# (486 nm), and D$ (434 nm).
• The collided CTs have fully formed into a single plasmoid and visible light is emitted from inside the core plasma region.
• After CTs merge, the camera captures the equilibrium phase. From those images, the lifetime of the CT can be estimated as approximately 50 μs.
Fig. 6. Contour plot of internal magnetic field measurements using magnetic probe array.
• Figure shows the result of magnetic field measurements.
• The two CTs start colliding around t=30 μs.
• At t=40 μs, the two CTs have fully formed into a single
closed-field line structure.
• During this time, the poloidal surface clearly shows the magnetic axis which separates the region between axial field direction and reversed direction, which means the collided CTs are formed as an FRC-like plasmoid.
MCPG Drift tube
Bias coil Gas inlet ports
Inner and Outer electrodes
Drift tube MCPG
Beginning of collision
Fig. 7. Contour plot of ne scanned over the radius at the mid-plane using triple Langmuir probe, compared with the typical excluded-flux radius.
Estimate of the Excluded-Flux Radius and Magnetic Axis
Axial field coils
Magnetic probe and Triple Langmuir probe
Fast-framing camera
ØElectron density and temperature measurements
Fig. 1. Schematic drawing of CT collision and merging experiment device: two MCPG, drift tube, glass chamber, axial magnetic field coil, and transverse magnetic field coil
Fig. 4. Split color image into RGB images:
(a) Red image (b) Green image (c) Blue image
• rl: loop radius
• Bv, Bp: Magnetic probe signals of vacuum and plasma
shot at the glass tube radius
• Φv, Φp: Magnetic flux signals of vacuum and plasma
shot inside glass tube
CT collision and merging system
1. Neutral gas is injected between electrodes via gas injection ports while Bias field is applied.
2. Plasma is generated when the main gun power supply breaks down the gas in the gap between electrodes.
3. Theradialcurrentbetweenelectrodesgeneratesatoroidal magnetic field which accelerates the plasma by Self-Lorentz force.
4. The accelerated plasma is interlinked with applied bias field, which provides poloidal flux. Thus the spheromak-like plasmoid is formed and ejected from the MCPG.
nTypical MCPG Waveforms
Main discharge
Typical Parameters
Value
2 - 5 × 10²¹ (m-3) 30 - 40 (eV) 0.4 (mWb) 50 - 150 (km/s)
0.4 - 0.8 (kJ) 200 (kJ/m3)
Tail
• The color image can be to split into RGB images.
• Assuming the visible lines in this experiment, the Balmer lines, are the dominant wavelengths,
Figs 5(a) and 5(c) can be used to evaluate the plasma’s behavior.
• Magnetic field lines appear clearly around the glass chamber in Figs 5(a) and 5(b).
• In Fig 5(c), the (hot) core plasma is captured; (cold) plasma external to the core is not visible. • Plasma core motion can also be captured by analyzing the blue color image.
t (μs)
Fig. 2. Time evolution of gun current.
t (μs)
Fig. 3. Time evolution of PMT TOF signals.
• • •
Charge Voltage: 8-12kV Current: 120-150 kA Rise time: ~10 μs
n e
Te Φ
• The electron density dramatically increased after CTs merge, and is distributed inside the excluded-flux radius.
• In the radial distribution of the electron density, the peak density is located around r=8 cm. Assuming the collided CTs turn into single FRC-like plasmoid, the separatrix radius rs can be estimated as 11.3 cm from theoretical model of magnetic axis R.
• After CT merging, FRC-like plasmoid remains. nSummary and Conclusion
• New CT collision/merging experiments using two MCPGs have been conducted and successfully produced/formed a single FRC-like plasmoid.
• The fast–framing camera captured the merging process as well as some color changes in the plasma.
• By separating color images into RGB images, we were able to identify the hot and cold regions of the plasma.
• The separated image capture: the FRC shape, its decay time, and instabilities.
v⊥ E
kin Upeak
nProbes installation
CT signal
Diagnostic
Pairs of magnetic probe and flux loop
Magnetic probe array Triple Langmuir probe
Object
Excluded-flux radius: r∆%
Magnetic field: Bz, and Bθ Electron temperature and
density: Te, and ne
Magnetic and Electric probes
Magnetic probe and Flux loop
Plasmoid
Vacuum Vessel rw ~30 cm
Axial Field Coil
Fig. 5. Axial view of an installation of magnetic probe and triple Langmuir probe at mid-plane of confinement vessel.
•
To evaluate the plasmoid parameters, we install diagnostics at the mid-plane.
t=36 μs
CTs
t=40 μs
Colliding CTs
t=44 μs
Radial expansion
t=48 μs
t=52 μs
CTs Merged
Current (kA)
Intensity (A.U.)
Electron density (m-3)
nCamera RGB images
(a) (b) (c)
R
Excluded-flux radius
Magnetic Axis
∆% rDF
| 1 |
