
Page 3 - Demo
P. 3
022503-3
Steinhauer, Berk, and TAE Team
Phys. Plasmas 25, 022503 (2018)
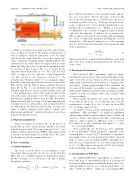
FIG. 1. Idealized core and periphery structure.
coordinates. Several previous studies used the same idealiza- tion, e.g., Refs. 9, 10, and 12. The plasma is axisymmetric as well as symmetric about the mid plane (z 1⁄4 0); the figure only shows the “right” half. The core is the “square-end” object of radius Rs (separatrix radius) and half-length Zs. The neutral sheet is the surface where the magnetic flux w is min- imum. In reality, this is the O-point, but the idealized geome- try stretches it into a sheet. The core is bound by the separatrix (black dashed line, w1⁄40). The scrape-off layer (SOL) is composed of an “adjacent” section alongside the core that connects to an “extension” section Zs < z < ZM along the axis. The lines marked “w” are a magnetic surface shared in common by adjacent and extension sections of the SOL. At the end, the SOL is mirror-confined. The heavy black line in Fig. 1 is an idealized perfectly conducting boundary with fixed w; it has a reduced radius at the end (z 1⁄4 ZM) marking the location of the magnetic mirror at the end of the main confinement vessel. The mirrors act as the first element regulating end loss from the SOL. Beyond the domain shown in Fig. 1 is a long exit stream leading through a formation section, a plug mirror, and an expansion diver- tor. Although the idealized geometry in Fig. 1 seems to be crude, a particle transport model with a realistic two- dimensional equilibrium16 yielded results quite close to those using the idealized geometry.9
3. Physical assumptions
Static force balance is assumed, rp 1⁄4 j B, where p is the pressure, j is the current density, and B is the purely poloidal magnetic field. This neglects inertial “force” (cen- trifugal), which is small in typical FRCs. The magnetic field is related to the flux variable w(r,z) by B 1⁄4 $w h^/r, where h^ is the unit vector in the azimuthal direction.
B. Core continuity
1. Particle transport
The focus, as noted earlier, is on the transport of par- ticles rather than energy since the two are closely related in FRCs. The core continuity equation for plasma flow equates the rate of change of core inventory to the flux of plasma through the separatrix:
Here, 2pRs2Zs and 4pRsZs are the separatrix volume and sur- face area, respectively. The two timescales on the left side are the inventory change time sinv and the timescale associ- ated with a particle source ssrc. In the present analysis, the source is ignored (1/ssrc 1⁄4 0) so that the global particle con- finement time sN is identical to sinv.20 Finally, vn is the parti- cle diffusivity (“rate”) relative to magnetic surfaces. On the right side, the subscript “s” denotes the separatrix value. Observe that vn is referenced to the density gradient, lumping the effects of temperature gradients, including the electron thermal-force. This particle transport rate at the separatrix may be solved for by introducing the density gradient length at the separatrix Ln,s
hni RsLn;s
vn;s1⁄4n 2s : (5)
sN
This is an interpretive equation in that quantities on the right side come from common measurements in the absence of source terms.
2. Density profile inference
Most historical FRC experiments employed single- chord interferometry, which (with excluded-flux data) is ade- quate to infer the average density hni. Few experiments had multi-chord interferometry from which ns (separatrix den- sity) and Ln,s (density gradient-length at the separatrix) can be extracted. Fortunately, the smaller set of instances with multi-chords exhibited consistent trends, allowing reasonable estimates of both, for examples, where more complete data were not available.
First, consider the density ratio hni/ns. The density has been relatively flat in the core so that this ratio is in the neighborhood of unity. It is close to unity for thick SOL (Ln,s not small compared to Rs).
An estimate of hni/ns can be found using the “two-point equilibrium” (2PE) paradigm,21 an analytical equilibrium which assumes high-elongation, simple forms of radial and axial force balance and employs a pressure vs flux function with two “shape” parameters. 2PE gives hni/ns 1 þ Rs2/ Rw2, where Rw is the conducting wall radius, i.e., hni/ns 1.1–1.3 for typical FRCs.
Next, consider the edge thickness Ln,s. It is comparable to the ion gyroradius17 which at high-b is comparable to the ion skin depth ‘i 1⁄4 (mi/l0e2hni)1/2. An analysis of experimen- tal examples where Ln,s was measured showed the observed range of ratios Ln,s/‘i. In traditional FRCs (Appendix A of Ref. 21), Ln,s/‘i ranged from 1 to 2.5, with a typical value Ln,s/li 1⁄4 1.5. This value is also typical of C-2U (shot #43628) in the intermediate time range of 2–4 ms.
C. Interpretation of FRC data
The published FRC data compendium21 is a dataset of 69 records from 15 experimental facilities. It is interpreted by using the 2PE paradigm assuming the density ratio hni/ns and edge thickness ratio Ln,s/‘i0 as just described. First, con- sider “traditional FRCs,” which are non-translated-FRC
2pR2s Zshni 1 þ 1 sinv ssrc
1⁄4 4pRsZs ðvnrnÞs:
(4)
