
Page 5 - Theory of ion dynamics and heating by magnetic pumping in FRC plasma
P. 5
072510-5 Egedal et al.
With the knowledge of vq provided by Eq. (6), we can now calculate the Jq action as a function of ðqt ; zt Þ simply by integrating over values q for which v2qðq; qt; ztÞ > 0, i.e.,
Phys. Plasmas 25, 072510 (2018) D. Orbit transition during z-oscillations
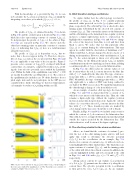
To explore further how the orbit topology is related to the profile of Jq ðqt ; zt Þ, in Fig. 6 we consider particular numerical orbits projected on to the ðq; zÞ-plane and (x, y)- plane, respectively. The orbit in Fig. 6(a) is observed to have turning points well-defined by the selected red contours of constant Jqðqt;ztÞ. This contour line intersects the bifurcation and the orbit undergoes the transition from a regular cyclotron motion to a figure-eight motion in its (x, y)-projection. To highlight these transitions, in Figs. 6(a) and 6(b) we change the color of the trajectory from blue to red, and later from black to green. We notice that for this particular orbit, Jqðqt;ztÞ is constant during the orbit transitions. This may appear in conflict with the observation of Landsman et al.16 which found that Jq always changes by about a factor of 2 during such transitions. However, with our definition of Jq in Eq. (7), the action integral is taken over all points with jvqj > 0. Thus, for the bifurcated regions Jqðqt; ztÞ includes contributions from the two matching cyclotron orbits, yielding a continuous profile of Jq ðqt ; zt Þ across the bifurcation line.
In Fig. 6(a), the orbit reaches its extreme values of z at the location where the red Jq-contour intersects the blue line with v2/ 1⁄4 v2, marked by the blue dots. The type of intersec- tion points with zt ’ 280 is common to all ion orbits in the FRC. Meanwhile, the type of turning points with zt ’ 140 is only applicable to a subset of FRC ions being confined to one half of the FRC cross-section. We mark this transition in the orbit through a change of color from black to red.
As an example of another orbit topology, the trajectory of Figs. 6(c) and 6(d) is characterized by a contour of Jq which does not intersect the bifurcation line. Thus, the orbit remains a figure-eight type without the regular cyclotron motion at any points along its trajectory. Again, the extreme values of z occur where the red Jq contours intersect the blue line with v2/ 1⁄4 v2. These transition points are marked by color changes in the trajectory (from blue to red to black).
Finally, in Figs. 6(e) and 6(f), we include a trajectory for which the contour of Jq does intersect the bifurcation line. This orbit, however, is trapped with mirror points that all fall outside the region encircled by the bifurcation line. This orbit is therefore at all location of the figure-eight type.
E. The effective potential for the slow z-oscillations
Above, we found that the contours of constant Jq pro-
vide the loci of the orbit turning points, and we will now
apply this result to determine the effective potential
v2?ðzt;JqÞ for the z-oscillation. As an example, Fig. 7(a)
shows color contours of constant v/ðqt; ztÞ with selected con-
tours highlighted by white dashed lines. The black lines are
again contours of constant Jqðqt;ztÞ, and the turning points
of the orbits will follow these black contours. In addition, the
contours highlighted in blue and red correspond to the orbit
Jqðqt; ztÞ 1⁄4
ð
qffiffiffiffiffiffiffiffiffiffiffiffiffiffiffiffiffiffiffiffiffiffi
v2qðq; qt; ztÞ:
v2q ðqÞ>0
The profile of Jqðqt;ztÞ obtained from Eq. (7) is shown in Fig. 4(b) and the central region is shown in Fig. 4(c), with black lines also representing contours of constant Jqðqt;ztÞ. To help interpret the profile of Jqðqt;ztÞ, the orbits of Figs. 3(e)–3(g) are repeated in Fig. 4(c). We observe how the orbits have turning points on particular contours of constant Jqðqt; ztÞ, indicating that Jqðqt; ztÞ here is a valid invariant along the trajectories.
The profile of Jqðqt;ztÞ is dependent on p/, but we notice that v does not appear in Eq. (7). Therefore, the pro- files of Jqðqt;ztÞ, such as the one presented in Figs. 4(b) and 4(c), are applicable to any value of the ion speed v. Figure 5 presents color contours of log10 ðv2/ Þ overlayed with black contour lines of constant Jq computed for values of p/, yield- ing the four effective potential cases studied by Landsman et al. Within the bulk of the equilibrium, ions with v2 < 100 are mostly described by case III profiles of v2/. The center of the equilibrium also includes case IV orbits, but these do not pitch angle mix and do not participate in the MP process considered here. In the following, we therefore limit numeri- cal examples for values of p/ falling within case III.
FIG. 5. Left: Color contours of log10ðv2/Þ for values of p/ corresponding to the four cases studied by Landsman et al. The black lines are contours of constant Jq. Right: Cuts of v2/ vs. q for z 1⁄4 0.
pffiffiffiffi
dq
(7)
in Figs. 6(c) and 6(d) with v/ðqt; ztÞ 1⁄4 7:8 and Jq 1⁄4 15, respectively.
Along each Jq contour, we can evaluate v2/ as a function of zt. Let qJ ðzt ; Jq Þ parameterize the values of q along the set contour lines. The effective potential for the z-oscillations is then given by v2?ðzt; JqÞ v2/ðqJ; ztÞ. As an example,
