
Page 7 - Theory of ion dynamics and heating by magnetic pumping in FRC plasma
P. 7
072510-7
Egedal et al.
Phys. Plasmas 25, 072510 (2018)
FIG. 7. (a) Color contours of constant v/ðzt;qtÞ with particular values highlighted by white dashed lines. The blue line denotes v ðz ; q Þ 1⁄4 7:8 and
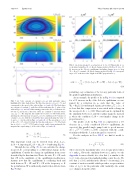
FIG. 8. (a) Action integral Jz as a function of ðv;JqÞ. (b) This profile of vsb is calculated using Eq. (8). (c) Speed changes predicted by Eq. (9) for a 1% B0 increase in the Solovev equilibrium (including changes in qs to keep W0 1⁄4 B0 q2s =2 constant). (d) Speed changes predicted by Eq. (9) correspond- ing to a 1% reduction of the length of the FRC proportional to zs.
xDv1⁄4 x Jzðv;Jq;p/;WþdWÞJzðv;Jq;p/;WÞ; vsb
(10)
permitting easy estimation of Dv for any particular form of the applied equilibrium perturbation.
As an example, the profile of Dv in Fig. 8(c) is computed
for a 1% increase in B0 of the Solovev equilibrium, accom-
panied by a reduction in q such that the value of
corresponds to the speed of the orbit in Figs. 6(c) and 6(d). The black lines
are contours of constant Jq, with the red lines indicating the Jq value of the
orbit in Figs. 6(c) and 6(d). Orbit turning points in the fast q oscillations fol-
low the Jq and in the z-direction orbits are confined to intervals where
v/ ðzt ; qt Þ < v. The magenta line marks the location of orbit bifurcations,
allowing the orbit topology for any ðJq ; vÞ to be established. (b) Contours of
constant v? ðzt ; Jq Þ, with the red and blue lines again indicating the value of
W0 1⁄4 B0q2s =2 is unchanged. Again, given that Jq ’ 2v?, it is clear that this compression is associated with a change in the ion speed, Dv ’ v?=100. This result can be explained by the similarity between Jq and the regular magnetic moment l, where the condition v2?=B 1⁄4 const implies change in Dv proportional to v? .
The profile of Dv in Fig. 8(d) is computed for a 1%
decrease in zs of the considered Solovev equilibrium. As
J and v/ 1⁄4 v for the orbit in Figs. 6(c) and 6(d). (c) The green line is v?ðztÞ
pffiffiffiffi
pffiffiffiffiffiffiffiffiffiffiffiffiffiffiffiffiffiffiffiffiffiffi
q
of the Jq 1⁄4 15 cut in (b), while the blue line indicates v 1⁄4 7.8. The black
line is vz ðzt Þ 1⁄4 6 v2 v2? ðzt Þ and is barely visible from underneath the magenta line, representing vz of the orbit of Figs. 6(c) and 6(d).
@ v 1 @ J z
@t1⁄4vsb@t : (9)
expected, this parallel single pump leads to speed increase
/tt s
pffiffiffiffi
v1⁄4cst;Jq 1⁄4cst
Dv ’ v2 v2?=100 1⁄4 vz=100, consistent with the condi- tion imposed that the Jz action integral is conserved.
For the analysis in Secs. III–V, we find it useful to introduce:
qffiffiffiffiffiffiffiffiffiffiffiffiffiffiffiffiffiffiffi
n 1⁄4 1 Jq=J0; (11)
where J0ðvÞ is the maximum value of Jq for any given values of v and p/. Given the similarity between Jq and l (see the Appendix for more details) it is clear that n is similar to the jvkj=v term often used in standard guiding center theory. We note that n 2 1⁄20; 1 and that in the absence of scattering n is a constant of motion variable which provides a representative value of jvkj=v for the particular orbit (naturally, the actual vk =v changes along the orbit).
result can be derived from dJz ðv; Jq ; p/ ;
This important
tÞ=dt 1⁄4 0, imposing dJq=dt 1⁄4 dp/=dt 1⁄4 0 and using Eq. (8).
Through the use of Eq. (9), we can calculate the change in speed Dv corresponding to a differential change in the equilibrium. Consider the change in equilibrium from a state described by the flux-function W into the state W þ dW, such that dW is the amplitude of the equilibrium modification. Assume now that the equilibrium is oscillating back and forth between W dW and W þ dW at the frequency x. If the perturbation dW is sufficiently small, it then follows from Eq. (9) that:
pffiffiffiffiffiffiffiffiffiffiffiffiffiffiffi
