
Page 3 - Cross-separatrix simulations of turbulent transport in the field-reversed configuration
P. 3
Nucl. Fusion 59 (2019) 066018 C.K. Lau et al
Figure 1. (a) The magnitude of the equilibrium FRC magnetic field is shown as the color of the filled contour plot, and (b) the equilibrium density is shown as the color of the filled contour plot. Note that the magnetic field null region (Z = 0 m, R ~ 0.25 m) is not included in the simulation domain. The black contour lines correspond to drift-surfaces corresponding to different poloidal flux contours. The distance from the machine axis to the separatrix (the last solid line before the dashed lines corresponding to negative flux) at the outer midplane is Rs = 38 cm. The magnetic coordinate system referred to within the paper is also shown: ψˆ is the direction of radially increasing poloidal flux, θˆ is the direction along the magnetic field-lines, ie. poloidal, and ζˆ is the direction about the machine axis, ie. azimuthal or toroidal.
Table 1. Simulation parameters in units of cm at R = 53 cm (the distance from the machine axis) where SOL linear instability is found, where LT,i and LT,e are the ion and electron temperature scale lengths, Ln is the density scale length, and ρi and ρe are the ion and electron gyroradii.
LT,i LT,e Ln ρi ρe 5.36 ∞ 10.7 1.1 0.022
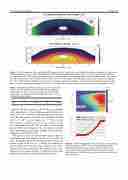
a factor of 100. When nonlinear δ⃗E × ⃗B effects are included in the simulations, ie. when simulation marker particles are subjected to δ⃗E × ⃗B drift due to the self-consistent fields that arise, the mode saturates at a SOL mode amplitude of about eφ/Te ∼ 5 × 10⁻² as seen in figure 2 at t ≈ 1.25 ms. On the other hand, the saturation level in the core is about a factor of ten lower than in the SOL due to a balance of the inward spread and the local damping in the core region, consistent with experimental measurements showing lower fluctuation amplitudes in the FRC core [10].
This process can be seen in the bottom panel of figure 2 which shows the mode amplitude in the core and SOL: ini- tially, the unstable mode first grows in the SOL but has not started to grow in the core; at t ≈ 0.5 ms, the radial eigen- mode has formed such that the mode amplitude in the core is growing at the same growth-rate. This whole process is also shown in the top panel of figure 2, which shows the mode growing in the SOL first before spreading into the core.
Figure 2. (TOP) The magnitude of the electrostatic potential along the outer midplane, φ(R, Z = 0, t), is shown with the colorbar following a logarithmic scale, and the dashed line indicates the location of the separatrix. (Bottom) Line-outs from the top plot corresponding to the SOL and core regions are shown in green and red, respectively.
3
