
Page 5 - Cross-separatrix simulations of turbulent transport in the field-reversed configuration
P. 5
Nucl. Fusion 59 (2019) 066018 C.K. Lau et al
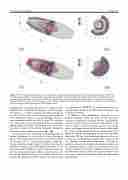
Figure 4. The electrostatic fluctuation eφ/Te is shown at the exponential growing stage (a) and (b) and after saturation (c) and (d) from two different perspectives. The purple shell represents the separatrix, and the outer pale green shell represents the outer boundary of the simulation domain. In the second view (b) and (d), the dark ring indicates the magnetic null region which is excluded in the simulation domain; however, the inner and outer regions are still connected along the field-lines. This is more clearly seen in the first view (a) and (c) where the magnetic null region appears as the hollow section.
integrating the electrostatic potential eφ/Te along the outer midplane at Z = 0 and binned according to toroidal wavenum- bers (where kζ = n/R) for a duration after saturation (between t = 0.949–1.03 ms). The mean simulation spectrum is plotted as the solid lines with green (red) corresponding to the spec- trum calculated from the core (SOL) region. The variations over time for the spectra are plotted as the corresponding shaded regions in the figure. The quantity of the electrostatic potential is related to the density fluctuation through the
Boltzmann relation (adiabatic response), eφ = δne . Te n0
In comparison, the experimental measurements [10] of density fluctuations ˜n/n are plotted as a scatter of points in figure 5. The density fluctuation data was measured via DBS [9, 10] between 0.4–1.2 ms after plasma initiation in FRC dis- charges which had similar lifetimes (4–10 ms) exceeding the past FRC scalings [7]. The DBS diagnostic launches narrow Gaussian beams with different tunable frequencies and meas- ures the backscattered signal, which is proportional to the local density fluctuation level at the resonant toroidal wave- number. The probed wavenumber and the scattering location
are calculated via GENRAY ray tracing based on recon- structed density profiles from CO2 laser interferometry and far infrared scattering.
In addition to being quantitatively comparable in nor- malized fluctuation levels, the shape of this fluctuation spectrum is qualitatively consistent with the experimentally measured density fluctuation spectrum. Fluctuations in the SOL are largest at long wavelengths and decrease towards shorter wavelengths due to the inverse cascade, which shifts the energy from the unstable shorter wavelength modes to the longer wavelengths. Fluctuations in the core are much lower than in the SOL due to the stabilizing influences in the core and because the fluctuations originate from outside of the core. Although core fluctuations may appear to be higher in amplitude at longer wavelengths in the simulation than shown by experiments, this is because the fluctuations in the core originate from the SOL and so the amplitude varies over time. As shown by the shaded regions in the plot, the variations over time cover a range that would fall within the experimental measurements.
5
