
Page 4 - Cross-separatrix simulations of turbulent transport in the field-reversed configuration
P. 4
Nucl. Fusion 59 (2019) 066018
C.K. Lau et al
toroidal mode numbers can more easily satisfy these matching conditions, an inverse toroidal spectral cascade occurs from the higher amplitude shorter wavelength modes to the linearly stable longer wavelength modes.
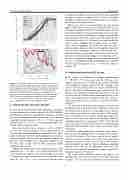
This process can be seen dynamically in the top panel of figure 3 which shows a subset of the simulated modes: at (A), the highest amplitudes belong to the high-n modes; at (B), the linearly stable low-n modes (dashed lines) have overtaken some of mid-n modes and nonlinear coupling is suggested by the growth-rates which are roughly twice the value of the lin- early unstable modes; at (C), the modes are saturating but the inverse cascade continues and the high-n modes are begin- ning to lower in amplitude; and at (D), some time after satur- ation, the high-n modes are the lowest in amplitude while the low-n modes are the highest. Snapshots of the toroidal wave- number spectrum corresponding to these four times are also shown in the bottom panel of figure 3. Overall, this inverse cascade corresponds to a change from an average wavelength of ⟨kζ ρs ⟩ ∼ 3 during the linearly growing phase, (A) and (B), to an average wavelength of ⟨kζρs⟩ ∼ 1.9 after the nonlinear cascade, (D).
5. Global turbulence from SOL to core
In this section, the simulations of multiple toroidal modes (n={0,5,10,...,75}) now span both the SOL and core regions. Note that the n = 0 mode is also included, allowing for an additional available channel for mode coupling. As in section 3, with the inclusion of the core region, instability only grows in the SOL, but fluctuations spread into the core. In addition, with multiple toroidal modes as in section 4, energy cascades from the unstable shorter wavelength modes to the longer wavelength modes. Together, these two processes shape the toroidal spectra of the FRC core and SOL as shown in figure 5.
The electrostatic potential mode structures, viewed along the machine axis at the center of the confinement vessel and viewed from afar, from times corresponding to linear growth and nonlinear saturation are shown in figure 4. The purple shell corresponds to the separatrix, and the grey ring is the region near the null point, which is not included within the simulation domain due to gyrokinetic validity. (Note that the inner core region is connected to the outer core region through the parallel direction itself, as more easily seen from the other viewpoint.)
Consistent with the simulations of sections 3 and 4, fluctua- tions are lower in amplitude in the core and an inverse cascade in the SOL is observed. The inverse cascade can be graphi- cally seen from the change in the short wavelength mode structures in figures 4(a) and (b) to the larger scale turbulent eddies in figures 4(c) and (d). Due to turbulence spreading from the SOL to the core, the fluctuations in the core also become more comparable in magnitude and more visible after saturation in figures 4(c) and (d).
The results of the simulation depicted by figure 4 are quantitatively shown in the toroidal wavenumber spectrum in figure 5. The spectrum from simulation is calculated from
Figure 3. (Top) The magnitude of the electrostatic potential is shown for several toroidal modes (only a subset of the modes in the simulation are shown for clarity). (Bottom) The toroidal modenumber spectra corresponding to times marked in the top plot are shown. Here, the spectra are normalized by the maximum value for qualitative comparison for different times. For the subset of toroidal mode numbers, the mode numbers
n = {5, 10, 25, 30, 55, 65} are equivalent to wavenumbers kζ ρs = {0.32, 0.64, 1.6, 1.9, 3.5, 4.2} in the SOL.
4. Inverse spectral cascade in the SOL
To focus on the characteristics of SOL turbulence, the domain of simulations in this section is limited to the SOL. Multiple toroidal modes can interact nonlinearly, resulting in a turbu- lence state. Simulations of this section allow for the inclusion of multiple toroidal modes (n = {5, 10, ..., 75, 80}) where the toroidal modes n = {5, 10, 15} were previously found to be linearly stable or damped modes.
Here, the unstable modes saturate at eφ/Te ∼ O(10−2) as seen in the top panel of figure 3. The saturation levels of these multiple-mode simulations are comparable to the single- mode simulations. Since the main saturation mechanism is unchanged despite the restriction in simulation domain, the physics of these multiple-mode simulations confined to just the SOL region remain valid for FRC simulations which include the core region.
Initially, the largest and fastest growing modes of this simulation are n = 55 and n = 65. In these simulations, dif- ferent modes can couple to each other through the beating of two waves to excite a third, when wave matching condi- tions (−→k1 + −→k2 = −→k3 , ω1 + ω2 = ω3) are met. Because lower
4
