
Page 3 - Direct observation of ion acceleration from a beam-driven wave in a magnetic fusion experiment
P. 3
NaTurE PHysIcs
a
Articles
b 150
100
50
30
25
20
15
10
5
1.0 0.5 0.0
–0.5
4.0 2.0
0.0 0.6
0.4
0.2 0.0
1.0 0.8
0.6 0.4
0.2 0.0
4.0 2.0
0.0 0.6
0.4
0.2 0.0
0 10 20 30 40 50 60 70 r (cm)
0
1
2
3
4
5
Plasma parameters
V (kV)
00 –2 0 2 4 6 8
t (ms)
c 1011
1010
109
108
107
–2 0 2 4 6 8
t (ms)
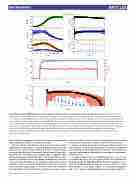
Fig. 2 | Basic plasma and NBi parameters, and a comparison of the measured and calculated neutron emission rates. a, Radial profiles (left column, taken at t = 1.5 ms)) and time histories (right column) of plasma parameters averaged over 57 similar shots. Top row: rigid rotor magnetic field profile (note that the internal magnetic field is not measured) and external magnetic field as a function of time. Middle row: Abel-inverted electron density and the time history of the average density inside the FRC. Bottom row: electron temperature profile measured by Thomson scattering (red diamonds), by an edge Langmuir probe (red triangles) and the interpolated profile used in the fusion rate calculation (black line with blue error bars). The upper limit ion temperature profile is shown with orange error bars. The right panel shows the time history of the temperatures at the field null, with ions in orange and electrons in blue. b, NBI current (black line with cyan error bars, left axis) and voltage (red line, right axis), both averaged over the five beams.
c, Measured neutron rate (black line with salmon error bars) and calculated thermonuclear fusion rate (purple diamonds). In all cases, error bars represent s.d. of the mean.
Rate (s–1) I (A) T (keV) ne (1019 m–3) B (kG)
<T > (eV) <ne> (1019 m–3) Bext (kG)
wave. This mode propagates nearly perpendicularly to the magnetic field at harmonics of the ion cyclotron frequency.
The ion velocity distribution output from the mirror plasma simulation is shown in Fig. 5b. As the simulation evolves, the modes grow and one can see a high-energy tail drawn out from the main ion energy distribution in a time much shorter than the beam slow- ing down time. This tail is small enough to have a negligible effect on the macroscopic distribution (that is, the temperature as deter- mined by a Gaussian fit does not change, as illustrated by the solid lines), but large enough to have a significant impact on the fusion reactivity, due to the sensitive dependence of the fusion cross-sec- tion on particle energy. Figure 5c shows the fusion rate calculated by numerically summing over binary collisions. It can be seen that
in 8 μs, less than 1/100th of a beam slowing down time, the fusion reaction rate is increased by a factor of 30 above thermonuclear.
Based on the high-energy tail and enhanced fusion observed in this simulation, we conclude that the beam-driven mode is probably more active in the mirror plasma than in the core. This localization may also explain why the fluctuations do not degrade confinement of the FRC core.
A simple criterion based on Wakefield theory22 can be used to estimate the size of the wave electric field of the saturated ion Bernstein mode. In Wakefield theory, the mode amplitude satu- rates at the Tajima–Dawson field, E = mecωp/e, where me is the electron mass, c is the speed of light, ωp is the plasma frequency and e is the electron charge. Simply put, the maximum velocity a
NATuRe PhySiCS | www.nature.com/naturephysics
t (ms)
