
Page 5 - Direct observation of ion acceleration from a beam-driven wave in a magnetic fusion experiment
P. 5
NaTurE PHysIcs
a 1.2 1.0 0.8 0.6 0.4 0.2
Articles
c
1.4
1.2
1.0
0.8
0.6
0.4
0.2
Peaked
Flat
ωci is the ion cyclotron frequency. This simple estimate yields Esat = 3.6 × 10⁵ V m−1 for vφ = 0.5vb, close to the value found in simu- lation, Esat = 1.6 × 10⁵ V m−1.
cases are compared. The fusion enhancement is larger in the peaked case, by a factor of almost 2.
Discussion
We can now summarize the key ingredients required for generating the beam-driven wave: tangential NBI, a large population of supra- Alfvénic fast ions with large orbits, and a positive velocity space gradient. Fokker–Planck modelling has shown that if the fast ion slowing down time is too fast, velocity space gradients are quickly smoothed out and there is no free energy source for the wave. This explains why the mode is not observed in cooler, denser plasmas.
The number of suprathermal ions accelerated by the mode is small compared to the plasma inventory, but it makes an outsized impact on fusion reactivity due to the extreme sensitivity of the cross-section in this energy range. In principle, this effect could be exploited to increase the energy output of a fusion reactor or the fluence of a neutron source.
There is, however, a more important possible fusion-relevant application of this mechanism: alpha channeling23. One of the issues facing burning plasma sustainment is the control of alpha par- ticles, the high-energy products of the deuterium–tritium fusion reaction. The alphas are non-fusile, so they must be removed from the core to prevent ash accumulation and fuel dilution. However, to maintain high plasma temperature it is necessary that they first deposit their energy to the plasma. It may be possible to achieve both of these goals with ‘phase space engineering’, which uses a fast ion-drivenwavetochannelenergyfromfastalphasdirectlytothe fusion fuel ions.
Online content
Any methods, additional references, Nature Research reporting summaries, source data, statements of data availability and asso- ciated accession codes are available at https://doi.org/10.1038/ s41567-018-0389-0.
experiment
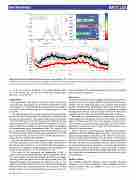
A key prediction of the model is that free energy in the beam drives the wave fluctuations and the orders-of-magnitude fusion enhancement. To test this prediction an experiment was designed in which a source of free energy in the beam was varied, in this case ∂f/∂v.
The neutral beam has three energy components due to the accel- eration of H2 and H3 molecules in the beam line, in addition to the primary H0 atomic species. The energy components are measured to be 85% full energy, 10% half energy and 5% third energy. The primary energy can be varied, and with five neutral beams it is pos- sible to flatten the total fast ion velocity distribution by staggering the primary beam energy from beam to beam. We compared two cases, one in which all neutral beams have the same primary energy (14.4 kV) and one in which the beams are staggered (two at 11.5 kV and three at 16.0 kV). In each of the two cases the total injected cur- rent and power were the same (6.8 MW).
To assess the difference in free energy between the two cases, we define a parameter to quantify both the steepness and extent of the velocity space gradient as, α = ∫ dv∂f ∕∂v, where the integral is performed over regions of positive gradient. For the peaked case, α = 2.5 and in the flat case, α = 1.8, a reduction of 1.4×.
The results of the experiment are summarized in Fig. 6. Figure 6a presents the calculated initial velocity distributions for the two cases. It can be seen that in the ‘peaked’ case (black curve), larger positive gradients are present than in the ‘flat’ case (red curve). The magnetic fluctuation spectrograms are compared in Fig. 6b. The peaked case clearly has more activity in the ion cyclotron frequency band (in both cases, the fluctuations die out at around t=3ms). Finally, in Fig. 6c the measured neutron rates in each of the two
NATuRe PhySiCS | www.nature.com/naturephysics
Peaked
Flat
b 1,000 800 600 400 200
1,000
800
600
400
Peaked
1.8
1.5
1.2
0.0 200 0.0 0.5 1.0 1.5 2.0
0.9 Flat 0.6
0.3
0.0 0 1 2 3 4
v (106 m s–1)
t (ms)
Neutron rate (a.u.) f(v)
f (kHz)
f (kHz)
b2 (10–4 G2)
0.0 01234
t (ms)
Fig. 6 | Controlling mode activity by reducing velocity space gradients. a, Calculations of the initial velocity distributions show the difference between the peaked (black curve) and flat (red curve) cases. b,c, The magnetic fluctuations (b) and neutron rates (c) are greatly reduced in discharges with reduced initial velocity space gradients. Error bars in c (shaded area) represent s.d. of the mean.
