
Page 4 - Direct observation of ion acceleration from a beam-driven wave in a magnetic fusion experiment
P. 4
Articles
a
NaTurE PHysIcs
b
c
15 10 5
Deuterium
5 4 3 3 2 1
b 100 10–1 10–2 10–3 10–4
0.0
1.0 0.8 0.6 0.4
0.2 0.0
Measured
Calculated
c
30 20 10
0
0.5 1.0 1.5 v (106 m s–1)
Thermonuclear rate
5 10 15
t (μs)
c 10–3
10–4 10–5 10–6 10–7
1
10
d 1.0 0.8 0.6 0.4 0.2 0.0
0 20 40 60 80 r (cm)
0.5
0.0 –0.5
766 b 0.8 511
255
0
r = 0 cm r = 15 cm r = 30 cm r = 45 cm
0.9 1.0 ω/ωci
–0.5
0.0 0.5 x (m)
–255 –511 –766
0.6 0.4 0.2 0.0
ω/ωci
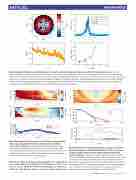
Fig. 3 | Summary of measurements of fluctuations in the electron density and magnetic field associated with the beam-driven mode. a, An ideal magnetic equilibrium shows the magnetic field strength (colour map), separatrix (dotted line) and field null (dashed line), as well as the measurement locations of the density (coloured horizontal lines) and magnetic field (orange dot). b, Density fluctuation spectra show a clear peak near the ion cyclotron frequency, ωci, at all radii, even those outside the separtrix. c, Magnetic fluctuation spectrum, showing that multiple harmonics of ωci are excited. d, Size
of the density fluctuations relative to the mean density peaks outside the separatrix. Error bars are propagated from the s.d. of the time-averaged line- integrated density and the 1σ error estimate of a Gaussian fit to the frequency spectrum.
a 15 Hydrogen 5 a 10 –2 43 8 –4
10 36 –5
–7
–10 –12
524
1 –9
002 0123450
t(ms)
–2 –1 0 1 2 K ρi
00 012345
t (ms)
012345 t (ms)
Fig. 4 | Measurements of the energy spectra of charge exchange neutrals at the edge of the plasma reveal ion acceleration coincident with a
rise in neutron emission. a–c, Neutral hydrogen (beam species) energy spectrum (a), neutral deuterium (plasma species) energy spectrum (b) and measured (blue with grey error bars representing s.d. of the mean) and calculated (red) neutron flux (c). The calculated neutron flux is obtained from the measured deuterium energy spectrum.
particle can obtain from electric field acceleration in a wave period is the phase velocity. By making the substitutions me→M, c→vφ and ωp → ωci we obtain the ion Bernstein analogue, Esat = Mvφωci/e, where M is the deuteron mass, vφ is the wave phase velocity and
0
0.7 0.8
1.1 1.2
B (G)
Signal (a.u.) Signal (a.u.)
log10(amplitude)
Rel. fusion rate
f (v) ω/ωci δ∫ndl / ∫ndl (10–4) ∫ndl (1011 cm–2)
Neutrons (a.u.) Energy (keV) Energy (keV)
δB (G) y (m)
Fig. 5 | Simulation of the beam-plasma system reveals the three features observed in experiment: fluctuations at harmonics of the ion cyclotron frequency, a high-energy tail on the main ion species and enhanced neutron production. a, Dispersion relation from PIC simulation of β = 0.1 plasma showing the excitation of multiple ion Bernstein modes at harmonics of the ion cyclotron frequency. b, Plasma ion velocity distributions at t = 0 (blue) and t = 8 μs (red) in the simulation. The Gaussian fits for each time are plotted as solid lines and overlay each other. c, Corresponding neutron rate, normalized to the thermonuclear rate, as a function of time. The generated tail enhances the fusion rate by a factor of nearly 30.
t = 0 μs t = 8 μs
NATuRe PhySiCS | www.nature.com/naturephysics
