
Page 3 - Characterization and calibration of the Thomson scattering diagnostic suite for the C-2W field-reversed configuration experiment
P. 3
10C120-3
Ottaviano et al.
Rev. Sci. Instrum. 89, 10C120 (2018)
TS) and 52 cm (jet TS) from the beam paths on an alignment stage which allows for accurate position adjustments. Rayleigh scattering is used for a final alignment of the collection optics systems.
The image plane of the collection optics is designed to match the fiber optics acceptance angle and the numerical aperture of the polychromator to maximize signal transmis- sion. The scattered light has a broadband nature from 850 nm to 1070 nm due to the Te range from 10 eV to 1 keV. The design of the collection lenses consists of two achromatic doublets, and each doublet has a positive power low dispersion element made from crown glass BK7 and a negative power high dis- persion element made from flint glass SF1. The image quality is optimized with Zemax Optical Studio Software to minimize the spot diagrams for different field positions at wavelengths of 1064 nm and 850 nm, as shown in Fig. 3.
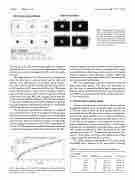
The image plane predicted by modeling was compared to actual measurements of the image plane found by placing a 600 μm diameter fiber at different field locations. A HeNe light source was used to overfill a fiber cable mounted on a vertical rail at exactly 1.00 m from the first lens surface to simulate the real beam path to lens distance in the C-2W’s central plane TS system. A CCD camera was mounted behind the second lens to capture the fiber image formed by the double lens. The fiber
FIG. 4. Image plane model from Zemax compared to experimentally found image plane. Y and Z dimensions are defined as the vertical direction and the optical axis of the lens, respectively.
FIG. 3. Zemax model of the ray traces for the central lenses using a YAG fun- damental wavelength of 1.06 μm. On the right, the images of a 600 μm core diameter fiber filled with a HeNe beam at λ = 0.63 μm are shown through the collection lens at field heights varying between 0 cm and 35 cm.
output was then moved up and down the vertical rail from 0 cm to +30 cm in 5 cm intervals, and for each position, the camera was adjusted for a sharp image and its position was recorded along the image’s y and z dimensions. Figure 4 shows the comparison of the image plane predicted by the model with the experimentally found values.
The lens magnification was also verified by using the image plane spot profiles. The fiber core dimensions of the cable used to transmit the HeNe light is approximately 600 μm, and the calculated amplification at the center plane is 5.31. This is in good agreement with the model prediction of 5.35 for that location.
C. Polychromator system design
Previous spectrum survey results show a quiescent plasma
background radiation in the wavelength range from 850 nm
to 1070 nm. Table II shows the final passing band for each
wavelength channel. The filter spectral ranges are designed to
maximize the signal gradient over Te in each polychromator
wavelength channel for a measurement range from 10 eV to
2 keV. The relative signal in each channel of the polychro-
mator for different Te ranges is plotted in Fig. 5. The average
transmission in each passing wavelength band is greater than
80%, and the transmission at 1064.3 nm (except for the laser
−5
The APDs (Avalanche photodiodes) are Excelitas model C30956EH with a diameter of 3.0 mm and the following
TABLE II. Polychromator optical filter position and specifications. Light striking
channel) is less than 10
than 10−5 from 100 nm to 1200 nm. The reflection out of band is greater than 95% from 850 nm to 1070 nm.
. Transmission out of band is less
position
1 2 3 4 5
CW (nm)
928.0 1022.0 1046.0 1058.0 1064.3
FWHM (nm)
154 34 16 6 6
Cut-on (nm) 851.0 ± 3
1005.0 ± 2 1039.0 ± 1 1055.0 ± 1
1061.3 + 0/1
Cut-off (nm) 1005.0 ± 3
1039.0 ± 2 1055.0 ± 1 1061.0 ± 1 1067.3 + 1/0
