
Page 8 - Anatomy of a field-reversed configuration
P. 8
Physics of Plasmas ARTICLE
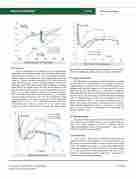
FIG. 8. R-Z trajectories of FRC experiments.
FIG. 10. Timeline of core plasma energy.
FIG. 9. Timeline of trapped flux.
B. Timelines
The next two figures show “timelines” of two critical quantities:
trapped flux and core plasma energy. The experimental shots employ
different field-control recipes. Figure 9 shows the trapped flux history.
Solid lines show reconstructed values /T and dashed lines the formula
values /0. The two can differ substantially. C-2U 43628 shows /T
rising well above / late in time, reflecting substantial shortening of 0
the plasma. The C2W examples 113301 and 113349 show /T running about 60% of the formula value. Note that the termination of the plasma in these examples marks the end of the neutral-beam injection pulse. Figure 10 shows the plasma energies. The formula values Ep0, Eq. (2), are dashed lines. The reconstructed values Ep,core are integrals of (3/2)p inside the separatrix in the core. The total plasma energy (core and periphery), not shown in the figure, is about three times higher than Ep,core as in Table III. Observe that in shot 113301 the reconstructed core energy runs about 60% of the formula value, whereas in 113349 it is about 85%. The results here and in earlier
Phys. Plasmas 27, 112508 (2020); doi: 10.1063/5.0022663 Published under license by AIP Publishing
figures call for physical interpretations, particularly in terms of effects outside the equilibrium condition per se, i.e., transport and stability.
C. Coupled transport
First, the presence of a significant peripheral plasma is consistent
23
with the effects of “coupled transport” as investigated elsewhere. Coupled transport has to do with the crosstalk between end loss in the periphery and cross field transport in the core and SOL; it can be explained as follows. If the end loss time sjj in the SOL is very short, it will dramatically “pull down” the density there and create a steep gra- dient $n. This in turn accentuates cross field transport (proportional to $n), “sucking” plasma out of the core. A consequence is that the particle confinement time sN can never enormously exceed sjj. Modern FRCs employ strong mirrors, giving mirror-like end confine- ment in the SOL. Indeed, Ref. 23 infers sjj 1ms and sN 5ms in an early C-2U shot. The former is many times the “free-streaming” end loss time, typically 3–5 ls.
D. Tearing stability
scitation.org/journal/php
It has already been suggested that the lower-radius bound of the shape domain is set either by transition to a mirror plasma (bifurca- tion) or by tearing instability. The latter is consistent with the neighboring-equilibrium theory of tearing stability21 which predicts instability in small-radius and long FRCs.
E. Sustainment
Figures 9 and 10 show evidence of significant quasi-steady sus- tainment of the FRC. The trapped flux Fig. 9 rises dramatically in the early stage of the plasma lifetime and then becomes more-or-less steady. This suggests the presence of current drive strong enough to build up the trapped flux and then sustain it. The plasma energy Fig. 10 also increases, more or less commensurate with the rise in /T, implying a strong heating source, in large part a consequence of neutral-beam injection and edge biasing.
27, 112508-8
