
Page 6 - Anatomy of a field-reversed configuration
P. 6
Physics of Plasmas ARTICLE
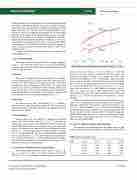
FIG. 5. Effect of field-curvature index on radius band, C-2W with Z/ 1⁄4 1.1 m.
scitation.org/journal/php
solution. Regarding (3), two physical causes of a limited shape domain
are noted. (a) Outside the domain, it may not be possible to balance
forces both radial and axial; this is the suggested interpretation of the
upper radius limit. (b) The FRC may be tearing unstable in come
conditions. This is the suggested interpretation of the lower-radius
boundary of the domain since tearing instability appears in smaller-
21
Consider the following interpretations of several aspects of the shape domains in Fig. 4.
1. Two-dimensionality
The shape domains are bounded below in length, ending for Z//Rw 1 in C-2W. This results from the 2D effect of field-line curvature at the mid plane. This effect is completely missing in the quasi-1D approximation.
2. Mirrors
The up-tilt of the radial bands with increasing Z/ has a straight- forward interpretation. This is a mirror effect and is particularly pro- nounced in C-2W because of its large mirror ratio. The mirror provides some axial confinement and thus reduces the need for the internal (core) axial force provided by field-line tension. Indeed, for a longer plasma closer to the end-mirror influence, the mirror force is strong enough that no internal flux at all is needed to balance axial forces: this gives rise to mirror plasma equilibria as in Fig. 3(b).
3. Rotation
The blue curves in the C-2W domain (Fig. 4) indicate a narrowing of the radius band when rotation (X 1⁄4 XJ) is introduced. This has little effect on the upper radius limit, but significantly pushes the lower bound upward.
4. Field shaping
Modern FRCs have the capability of shaping the wall flux ww(z,t). The field-curvature index Nf (Appendix A) measures the vacuum-field curvature at the mid-plane/wall. Positive Nf means the vacuum field (and wall flux) has a minimum at the mid plane while negative Nf indicates a local maximum. This also influences the shape domain: Fig. 5 shows the upper and lower radius bounds for a typical Z/ 1⁄4 1.1 m and rotation X 1⁄4 XJ. The vertical dashed line marks the Nf 1⁄4 0.1 case shown in Fig. 4. The radius band trends downward for lower Nf and narrows for Nf < 0. The “necking” feature for negative Nf represents the emergence of a broadened radius range for more negative Nf, which is not addressed here.
C. Actual core dimensions and trapped flux
The common approximations are Rs R/, Zs Z/, /T /0 [Eq. (1)], and Ep 1⁄4 Ep0 [Eq. (2)]. These estimates can now be checked. Table II shows ratios of actuals to approximations for a
Phys. Plasmas 27, 112508 (2020); doi: 10.1063/5.0022663 Published under license by AIP Publishing
radius FRCs according to the theory of neighboring equilibria. Indeed, the iterative relaxation algorithm for solving Eq. (4) is numeri- cally unstable if the purported R/-Z/ state is tearing unstable. Finally, an important bit of circumstantial evidence is this: the question of where in the{R/,Z/} domain that experiments plasmas “travel” will be addressed in Sec. IV.
series of cases with fixed Z/ 1⁄4 1.1 m as relevant to C-2W. The first two rows have realistic rotation X 1⁄4 XJ. The largest and smallest R/ correspond roughly to the upper and lower radius bound for this length as in Fig. 4. At the larger radius, the actual sizes run about 5% below excluded-flux values, and the trapped flux is about 3/5 the approximation. However, at the lower radius, the actuals fall dramatically. The last two rows in Table II show cases with no-rotation, i.e., Grad–Shafranov solutions. Here, Rs and Zs are both quite close to their excluded flux values. The trapped flux falls somewhat below formula but less so than with rotation. Table II shows the importance of considering a realistic rotation.
Section III A showed a bifurcation between FRC and mirror solu-
tions. Table II specifically the second example (low /T) indicates the
approach to bifurcation. This tendency arises both for longer Z/. [as
in Fig. 3(b)] and for smaller R/. Figure 6 shows how the trapped flux
/ depends on R and Z . Solid lines have realistic rotation (X 1⁄4 X ); T//J
the lone dashed line has no rotation (X1⁄40). Evidently longer and smaller-radius plasmas have lower /T, with rotation playing an impor- tant role. Smaller radius plasmas also have a lower ratio /T//0, and it falls to zero at a certain radius.
D. Current, plasma energy, and inventory
Two quantities of critical interest are the plasma energy Ep and current I and how they are distributed, in particular, what are their
TABLE II. Ratios to excluded-flux values.
X/XJ 1
R/ (m) Rs/R/ Zs/Z/ 0.450 0.95 0.94
/T//0 0.61
1
0 0.470 0.97 1.02 0.85 0 0.265 0.96 0.96 0.45
27, 112508-6
0.360 0.66 0.47
0.014
