
Page 5 - Tomographic imaging system for measuring impurity line emission in a field-reversed configuration
P. 5
D. C. Barnes and L. C. Steinhauer
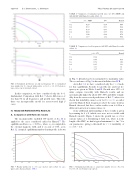
FIG. 4. Normalized growth rate (a) and real frequency (b) vs. normalized wave number for ‘ 1⁄4 2 mode with positive a (1.4, 1.6, 1.8, 2.0; bottom to top a curves, top to bottom b curves).
In this comparison, we have considered only the ‘1⁄41 fundamental. Comparison with Ref. 7 shows differences of less than 5% in all frequencies and growth rates. This vali- dates our incompressible model for non-reversed high b cases.
IV. RIGID ION ROTATION FRC RESULTS A. Comparison with Harned’s results
The incompressible, modified GV model of Sec. II is applied to the cases considered earlier by Harned.12 The equilibria used have x 1⁄4 0:05xci, where xci is computed in the external magnetic field, and b on axis of 0.65, as in Ref. 12. A typical equilibrium number density profile is shown
Phys. Plasmas 21, 022506 (2014) TABLE I. Comparison of normalized growth rates: w/o GV (MHD) and
022506-5
FIG. 5. Density profiles for a 1⁄4 0:6 case. (Lower curve is Ref. 12 case; upper curve discussed in Sec. IV B.)
FIG. 6. Normalized growth rate vs. axial wave number k for a 1⁄4 0.2, 0.4, 0.6, 0.8, 1.0, 1.2 (bottom to top curves).
with full GV with Harned’s results of Ref. 12.
a c/x*: MHD GV
Harned
0.2 0.20 0.14 0.08 0.4 0.39 0.33 0.24 0.6 0.60 0.53 0.38 0.8 0.80 0.75 0.58 1 1.00 0.94 0.74 1.2 1.19 1.12 0.84
TABLE II. Comparison of real frequencies (full GV) with Harned’s results of Ref. 12.
a x/x*: GV
Harned
0.2 0.24 ... 0.4 0.48 0.78 0.6 0.72 1.02 0.8 0.95 1.26 1 1.16 1.4 1.2 1.37 1.5
in Fig. 5. Density has been normalized to maximum value. The second curve of Fig. 5 is discussed in Subsection IV B.
As in Ref. 12, we have considered only the ‘ 1⁄4 2 mode for this equilibrium. Results for growth rate and real fre- quency are given in Tables I and II. Growth rates (GV col- umn) compare favorably with Harned’s results and are systematically higher by about 40%–50% and differ remark- ably from the non-reversed predictions of Ref. 7, where it is shown that instability cannot occur for 0 < a < 1, as earlier noted by Harned. Real frequencies show the same trend as Harned observed, but those earlier results seem to follow a different trend at low rotation values (a).
Some additional understanding of these results is given by scanning for k 61⁄4 0 (which cases were not accessible with Harned’s model). Figure 6 shows the growth rate vs. k for various values of a. Identifying k with p=L, where L is the length of the FRC, we find a typical minimum k 1 m 1 for our parameters, giving a threshold for ‘ 1⁄4 2 instability of a1⁄40:8 1:0.
