
Page 4 - Rotational stability a long field-reversed configuration
P. 4
032507-4
Rahman et al.
Phys. Plasmas 21, 032507 (2014)
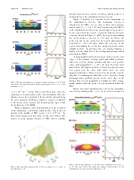
FIG. 3. The left side displays r-z contours for the ion density, ni, at 50, 100, and 150 ls. The right side panels display radial profiles for, ni vs. r, at the mid-plane, z 1⁄4 0.
1.2 1014 cm 3. At the 100 ls and 150 ls time steps, the separatrix is clearly visible at the outer boundary. Once the plasma crosses the separatrix it flows axially outward along the open, magnetic-field lines, which is a major contributor to the decay of the current. The density profile agrees with the predictions of the RRM.
Figure 4 displays a time-dependent plot for the evolution of the mid-plane, ion-density radial profile. The peak ion density at the middle of FRC reaches 1.2 1014 cm 3 by 50ls and remains near this value for the next 100ls. The region of peak plasma density of FRC moves radially
FIG. 4. Time-dependent radial profile for the ion density, ni vs. r and t, at the mid-plane, z 1⁄4 0.
inward, from 25cm to 20cm, in 100ls, which is due to a slowing down of the azimuthal-rotation velocity.
Figure 5 displays r-z contours for the magnitude of the azimuthal-ion velocity. The maximum velocity is obtained at the FRC core as early as 50ls after start-up, with a value Vih 1⁄4 2.0 107 cm/s, by this time the FRC is well-established. At 100 ls, the axial length of the peak ve- locity region had decreased, consistent with the pressure contours shown in Figure 3, while the region surrounding the cavity attains a velocity of 107 cm/s. At 150 ls, the peak velocity in the cavity has decreased approximately four-fold to 5.0 106cm/s, while the velocity of the region surrounding the cavity has changed polarity and is slightly positive. At all times the core plasma displays a higher velocity than that of the background plasma which surrounds the FRC.
A sharp gradient and velocity shear exists near the outer edges of the plasma, at large axial and radial positions, where the velocity changes polarity and takes on a positive value, with magnitude Vih 4.0 106 cm/s. For times later than 100 ls, the highest positive velocity develops in a nar- row region near the outer wall, where there are open magnetic-field lines. This reversed velocity profile is prob- ably due to a diamagnetic drift that evolves from the strong plasma-pressure gradient present at the outer edge of the plasma. The velocity magnitude is roughly an order of mag- nitude smaller than the peak velocity measured inside the FRC.
Figure 6 provides mid-plane line-outs for the azimuthal- ion velocity radial profile, vih(r), as it evolves in time for
FIG. 5. The left side displays r-z contours for the azimuthal-ion velocity, vih, at 50, 100, and 150ls. The right side displays radial profiles for the azimuthal-ion velocity, along the mid-plane, z 1⁄4 0.
