
Page 6 - Gyrokinetic particle simulation of a field reversed configuration
P. 6
052307-6
Gupta et al.
Phys. Plasmas 23, 052307 (2016)
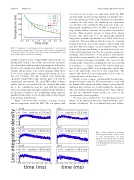
FIG. 7. Comparison of experimental electron temperature Te (red dot with error bar) and ion temperature Ti (red square with error bar) with simulated Te (blue line) and Ti (green line) with classical ion scattering and Ti (cyan line) with five times classical ion scattering.
formula is derived for an elongated FRC with perfectly con- ducting wall.2 In Fig. 6, the red line represents the experimen- tal excluded flux radius measured using magnetic wall probes, blue line is the simulated excluded flux radius using the above formula, and green line is the actual separatrix radius where w 1⁄4 0, as it is easily possible to numerically calculate the loca- tion of w 1⁄4 0 surface. The time evolution of the numerically calculated excluded flux radius matches quite well with the experimental observations. The actual FRC radius is always smaller than the ones predicted by the excluded flux radius due to the contributions from the open field line plasma. Unless increasing shine-through is included in the simulation, the later time evolution of the excluded flux radius cannot be simulated at later times as it is strongly influenced by fast par- ticles from the neutral beams.
Figure 7 shows the time evolution of average electron and ion temperature inside the FRC. The red squares with
error bars are the average ion temperature inside the FRC experimentally measured using impurity ion Doppler spec- troscopy, and the green line is the simulated ion temperature evolution. In early times, the simulated ion temperature exceeds that of the experiment. This is because in the one- dimensional equilibrium solver, the FRC is assumed to be a long cylinder with no curvature effects and no fast particles pressure. Thus, magnetic pressure is balanced by plasma pressure only. After 1ms or so, the numerically simulated temperature is within experimental error, albeit on the lower bound side. This may indicate that there may be a missing heating term in the ion energy equation. This heating term may have different origins, e.g., preferential heating of ions from axial plasma gun biasing, or anomalous fast ions scat- tering with background ions. For these plasma parameters, assuming classical behavior of fast particles, fast particles deposit their energy mainly to the electrons, and their contri- bution to main ion heating is negligible. The cyan color line is numerically obtained by assuming that fast ion scattering is anomalous, i.e., 5 times classical. The red dots with error bars are the averaged FRC electron temperature and the blue line is the numerically observed electron temperature. The numerically observed electron temperature is close to the ex- perimental values for first 2 ms or so.
Finally, we also compare experimentally measured line- integrated density using six CO2 interferometer cords with the simulated line-integrated density. Figure 8 shows that the simulated data (red line) are clearly tracking the experimen- tally observed line-integrated density profiles (blue), indicat- ing that the simulated density profiles are close to the experimentally observed profiles.
We have also performed the zero-dimensional power balance for the numerical data and compared with the exper- imental calculations. The zero-dimensional power balance
FIG. 8. Time evolution of measured line-integrated density of all six cords of CO2 interferometer (in blue) matches well with the time evolution of simulated line-integrated density (in red). Experimental observation has an error of 613%.
