
Page 3 - Diagnostic suite of the C-2U advanced beam-driven field-reversed configuration plasma experiment
P. 3
11D815-3 Magee et al.
Rev. Sci. Instrum. 87, 11D815 (2016)
FIG.4. Measuredneutronsignalasafunctionofdistancebetweenthesource and detector for the 50 in situ calibration points. For r > 50 cm, the source can be treated as a point source.
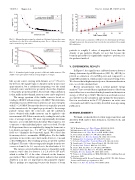
FIG.6. NeutronrateasafunctionofNBpowerfordeuteriumdopedbeams. At high beam power, the measured rate exceeds the rate predicted by a simple 0D calculation.
particles is roughly 5 orders of magnitude lower than the density of gas particles. Finally, we note that because the beam-in-gas method is significantly simpler to perform, it is the preferred method.
V. EXPERIMENTAL RESULTS
In Figure 6, the signal from a calibrated neutron detector during deuterium-doped NB injection (10% D2, 90% H2) is plotted as a function of total NB power and compared to a simple 0D calculation, which assumes classical slowing down. We observe that at higher injected power, the measured neutron rate exceeds the calculated rate.
Recent measurements with a neutral particle energy analyzer15 have revealed that a significant fraction of the beam injected fast ions is accelerated in the plasma from the injection energy of 15 kV up to 30 kV. This fast ion acceleration is not accounted for in the calculation and explains the discrepancy. Fast ion acceleration in the C-2U plasma is an active area of research and will be more fully described in an upcoming publication.
ACKNOWLEDGMENTS
We thank our shareholders for their support and trust, and all fellow TAE sta↵ for their dedication, excellent work, and extra e↵orts.
1M. W. Binderbauer et al., Phys. Plasmas 22, 056110 (2015). 2M. Binderbauer, AIP Conf. Proc. 1721, 030003 (2016).
3M. Binderbauer et al., Phys. Rev. Lett. 105, 045003 (2010). 4A. Necas, Bull. Am. Phys. Soc. 60 (2015), BP12.00033.
5H. W. Hendel et al., Rev. Sci. Instrum. 61, 1900–1914 (1990).
6T. Nishitani, Rev. Sci. Instrum. 63, 5270–5278 (1992).
7O. N. Jarvis, Plasma Phys. Controlled Fusion 36, 209–244 (1994). 8B. Laundy and O. N. Jarvis, Fusion Technol. 24, 150–160 (1993). 9T. Goorley, Nucl. Technol. 180, 298–315 (2012).
10E. Garate, Bull. Am. Phys. Soc. 57 (2012), PP8.00045.
11A. Smirnov, Bull. Am. Phys. Soc. 57 (2012), PP8.00042.
12J. Pamela, Rev. Sci. Instrum. 57, 1066–1068 (1986).
13T. Uckan et al., Technical Report ORNL/TM-2003/184, Oak Ridge National 14Laboratory, 2003.
A. Eleftherakis and M. Kocan, Technical Report DSTO-TN-1003, Defence
Science and Technology Organization, 2011.
15R. Clary et al., Rev. Sci. Instrum. 87, 11E703 (2016).
FIG. 5. Normalized pulse height spectra for DD and AmBe neutrons. The AmBe source gives pulses with an average height 1.9⇥ larger.
like a point source, varying with distance as 1/r2. Closer to the detector, the signal begins to depart from the point source approximation, but a calculation integrating over the actual extended source and detector geometry shows this departure to be a purely geometrical e↵ect. A key result of this calibration is that, unlike in the tokamak, neutron scatter can be neglected.
The energy spectrum of the AmBe source is broad, ex- tending to 10 MeV with an average of 4.4 MeV. The deuterium- deuterium reaction (D-D) fusion neutrons are monoenergetic with E = 2.45 MeV. Because the detector is typically operated in the current mode, the signal is proportional to the average particle energy times the count rate, and the calibration factor obtained with AmBe neutrons can be applied to the measurement of D-D fusion neutrons by scaling the rate by the ratio of average energies. We must experimentally determine this ratio, as it could di↵er from the ideal. This requires a low count rate so that individual pulses can be resolved. For the D-D spectrum, this is accomplished by firing the beams into a low density gas target (n0 ⇠ 5 ⇥ 1010 cm 3) with the magnetic field on to minimize the beam-wall signal. We collect data from many shots to accumulate 10 000 pulses. For the AmBe spectrum, we move the source far from the detector (⇠1 m) and collect 5600 pulses. The resulting spectra are plotted together in Figure 5. The ratio of the average pulse heights from the two sources is found to be 1.9, very close to the ideal value of 1.8.
The energy corrected calibration factor obtained from the neutron source data for detector 1 is 2.6 ± 0.4 ⇥ 107 n/s/V, which is within 8% of the value obtained via the beam-in- gas method. This excellent agreement indicates that neutral depletion is in fact not important in this parameter regime. This is perhaps not surprising because the density of beam
