
Page 5 - Equilibrium properties of hybrid field reversed configurations
P. 5
Nucl. Fusion 57 (2017) 076018 T. Asai et al
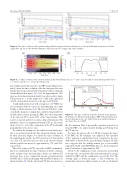
Figure 8. The time evolutions of the plasma radius and line-integrated electron density for (a) shot #44446 with an injection at 2.0 ms (single CT) and for (b) shot #48492 with three CTs injected at 0.5 (single) and 3.0 ms (double).
Figure 9. (a) Time evolution of the electron density pro le with CT injection (at t = 1 ms), and (b) radial electron density pro les before (t = 0.9 ms) and after (t = 1.5 ms) the CT injection.
gas would not penetrate into the core FRC region. Figures 8(a) and (b) show the time evolution of the line-integrated electron density that was measured by the CO2 interferometer along the chords illustrated in gure 5(b) [15]. An approximately 30% increase in the line-integrated density was observed in a single CT injection at t = 2.0 ms ( gure 8(a)). This is the equivalent of 60% of the particle inventory of the injected CTs [14].
A multi-pulsed injection with a frequency of 0.5kHz was also performed with two injectors, demonstrating successful fueling as shown in gure 8(b). The injected CTs have a sph- eromak-like magnetic con guration, and they temporarily tear the ux surfaces when entering the FRC. Also, the temperature of the injected CT is about 10% of the target plasma. This leads to some fast particle loss and cooling of the plasma. The disruptive effects are minimized when the CTs are injected in such a way as to cancel the component of the CT momentum perpendicular to the device axis.
To estimate the fueling rate, the radial electron density pro- le is reconstructed from the line integrated density pro le by Abel inversion. Figure 9(a) shows the time evolution of the radial density pro le; the CT is injected at 1.0ms in this case. The CT injection increases the peak electron density and the particle inventory by approximately 37% and 30%, respectively.
The effect of injected CTs, especially on FRC con nement, has been con rmed by the time evolution of the Dα emission in the vicinity of the injection plane. In the case without CT injection, there is not a signi cant amount of emission from the FRC after collisional merging with the FRC formation as shown in gure 10. On the other hand, CT injection increases
Figure 10. The time evolution of the Dα emission on the plane by the CT injector. The black dashed line is FRC without CT injection, the red chain line is the case with CT injection and the bold green one shows the case with PI.
the Dα emission. This is potentially caused by particle loss from the FRC core and/or neutral trailing gas owing from the CT injector.
To reduce the adverse effect of CT injection into the target C-2U FRC, the PI technique was employed. The intensity of Dα emission is signi cantly lower compared to the case without PI, as shown by the green bold line in gure 10. This trace suggests that the trailing neutral gas is successfully reduced by the PI on the MCPG. In this case, the increment of particle inventory is approximately 20%.
On the C-2U con nement vessel, bolometers are installed to measure the total particle ux and neutral particle energy emitted by FRC and the con nement vessel wall [16]. The viewing angle is shown in gure 5. The bolometers are mounted in a fan-array, which consists of a side-on 16 channel
5
