
Page 4 - Equilibrium properties of hybrid field reversed configurations
P. 4
Nucl. Fusion 57 (2017) 076018 T. Asai et al
Figure 6. (a) The vacuum eld pro le before CT injection. (b) The time evolution of magnetic probe signals obtained by the upper array (red solid line) and the lower array (blue dashed line). The arrows trace the initial peaks of the waveforms.
(a) (b)
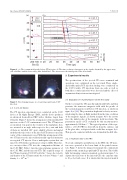
Figure 7. Fast-framing images of (a) neutral gas puff and (b) CT injection.
2.3. C-2/C-2U device
The CT injection experiments were conducted on the C-2U device at Tri Alpha Energy (TAE), and the device produces an advanced beam-driven FRC with a lifetime longer than 10 ms [4]. Figure 5 shows the arrangement of the installed CT injectors on the C-2U con nement vessel. The CT injectors are mounted 1 m apart in the vicinity of the mid-plane, they are oriented at an angle with respect to the z-axis and both of them are installed 180° apart, slightly off-axis and angled such that the trajectories of the injected CTs intersect near the center of the con nement vessel. With this arrangement of the two CT injectors, the injected horizontally opposed momenta are negated. CT injector 1 has a multi-pulse system that can inject two CTs with a repetition rate of up to 1 kHz. Therefore, we can inject three CTs into the con guration lifetime of the C-2U FRC. Table 1 lists the typical plasma parameter of the C-2U FRC and the injected CTs. The required energy of the CT injection into C-2/C-2U is 4 kJ m−3, hence the velocity and density of the CT must satisfy the velocity 70 km s−1 and density 1 × 10²¹ m−3.
3. Experimental results
The speci cations of the ejected CTs were examined and operations were optimized on the test stand. Then, single- and double-pulsed CT injection fueling were conducted on the C-2U facility. CT injections from one side as well as both sides (counter injection) were also tried and the effect of asymmetrical injection was investigated.
3.1. Evaluation of CT performance on the test stand
On the test stand, the CTs pass through the drift tube and then penetrate the transverse magnetic eld with the pro le of the vacuum magnetic eld before CT injection, as shown in gure 6(a) [14]. The penetration depth and velocity are mea- sured using the time-of- ight method from the time evolution of the magnetic signals, as shown in gure 6(b); the arrows trace the initial peaks of the magnetic eld waveform. The penetration speed of CT evaluated by this measurement is approximately 100 km s−1. The typical position of the sepa- ratrix rs of C-2U FRC is about 40cm from the entrance end of the glass tube, as depicted with a solid line in gure 6(a). This speed is consistent with the one obtained in the drift tube.
3.2. CT injection into C-2U FRC
To avoid a disruptive perturbation on the FRC, the CT injec- tors were operated at the lower limit of the particle inven- tory. Figure 7 shows the images from inside the con nement chamber with a neutral-gas puff and CT injection. The visible light fast imaging camera is mounted, as shown in gure 5, to capture the trajectory of the injected CTs; the exposure time is 10 μs for both cases. It is shown that the injected neutral
4
